Showing posts with label gold. Show all posts

Sunday, November 20, 2016

Post-Election Risk Trending Up in Treasuries and the Euro, Down in U.S. Stocks

You can always tell when the crowd gets long the VIX and ends up on the wrong side of the trade.  “The VIX is broken!” becomes an oft-repeated refrain, as does “The markets are rigged!” and the usual list of exhortations from those who are in denial.  The current line of thinking is that the world must be much more dangerous, risky and uncertain as a result of a Trump victory, yet the VIX is actually down 31.4% since the election – ipso facto the VIX is broken.

While I have more than a small soft spot in my heart for the VIX, I will be the first to point that taking an Americentric, equity-centric view of the investment landscape is dangerous and naïve.  More often than not, the issues that end up having a strong influence on the VIX are born on foreign soil and/or in other asset classes.  Just look at the recent history in China, Greece, Italy, currencies and commodities to name a few.

When it comes to looking at implied volatility indices as a risk proxy, I prefer to survey the landscape across asset classes, geographies and sectors, which is why I have developed tools such as a proprietary Macro Risk Index (more on this shortly) that look at risk across asset classes, geographies and sectors.

In the graphic below, I have isolated a handful of volatility indices that cut across asset classes and geographies to show how these have moved in the eight days following the election.  Note that Treasuries (TYVIX) and the euro (EVZ) have been trending steadily higher since the election as uncertainty related to the future of inflation and interest rates in the U.S. has risen, while the relationship that the Trump Administration will have with our NATO allies and the European Union is also somewhat murkier. 

Gold implied volatility (GVZ) initially moved sharply higher following the election, but has since receded, as gold prices fell swiftly after the election, but have since stabilized.  Meanwhile, emerging markets saw dramatic selling immediately following the election, but have bounced during the course of the past week as fears and implied volatility (VXEEM) have subsided.  Last but not least, the moves in crude oil and crude oil implied volatility (OVX) have been the least remarkable of the group


[source(s):  CBOE, VIX and More]

In aggregate, the picture is a mixed one in terms of implied volatility, risk and uncertainty.  As is often the case, risk has become elevated in certain asset classes, such as Treasuries and the euro.  In other areas, such as U.S. equities – and their VIXian barometer – there are winners and losers, with the result that a net bullish outlook has moved equity implied volatility lower.  This is not to say that a Trump Administration – whose cabinet members and policy priorities are largely unknown at this juncture – will not increase risk in some areas.  More risk is certainly on the horizon and if history is any guide, an Americentric, equity-centric view of the investment world is likely to be slow in identifying those risks.

Related posts:


For those who may be interested, you can always follow me on Twitter at @VIXandMore


Disclosure(s): the CBOE is an advertiser on VIX and More

Sunday, September 26, 2010

Chart of the Week: Gold and the Miners

From a technical perspective, the big event in the markets in the last week is undoubtedly the breakout in the S&P 500 index, but since I devote so much time to the SPX and its derivatives, I thought the time is ripe to recognize gold for hitting a new all-time high and bumping up against $1300 per ounce.

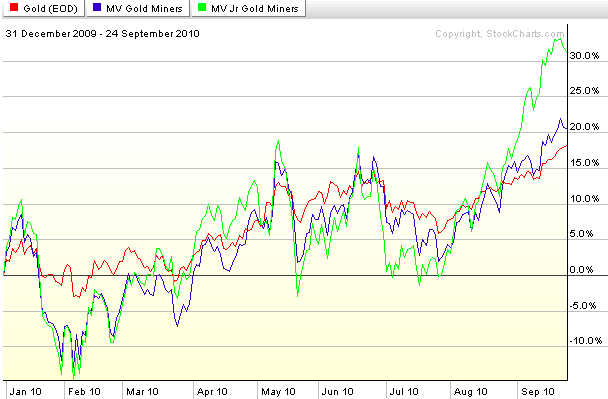
To put a slightly different spin on gold, in the chart of the week below I have elected to include the gold futures continuous contract (red line) and also two popular ETFs for gold miners: GDX, the large cap version (top holdings of ABX, GG and NEM), shown below in a blue line; and GDXJ, the junior gold miners ETF (green line.)

As the chart of 2010 performance shows, gold futures have been the least volatile of the group and have had about the same performance as GDX. While GDX and GDXJ track each other fairly closely, note that GDXJ has distinguished itself with superior performance over the course of the last month or so.

Predicting the future of gold is a daunting task, but if the bullish trend continues, GDXJ clearly has the potential to continue to deliver outsized returns – with commensurate risk, of course.

Related posts:


[source: StockCharts.com]

Disclosure(s): long GDXJ at time of writing

Thursday, September 16, 2010

Opportunities Arising from Unusually Low Implied Volatility in Gold

Gold sure seems like it has been acting more than a little crazy lately, with the commodity recently hitting new highs and threatening the 1300 level and ETFs for physical gold (e.g., GLD) and gold miners (e.g., GDX, GDXJ) attracting a great deal of attention.

If you listen to the media, a number of extreme positions are being bandied about, ranging from gold going to 10,000 to being described yesterday as the “ultimate bubble” by billionaire hedge fund guru George Soros.

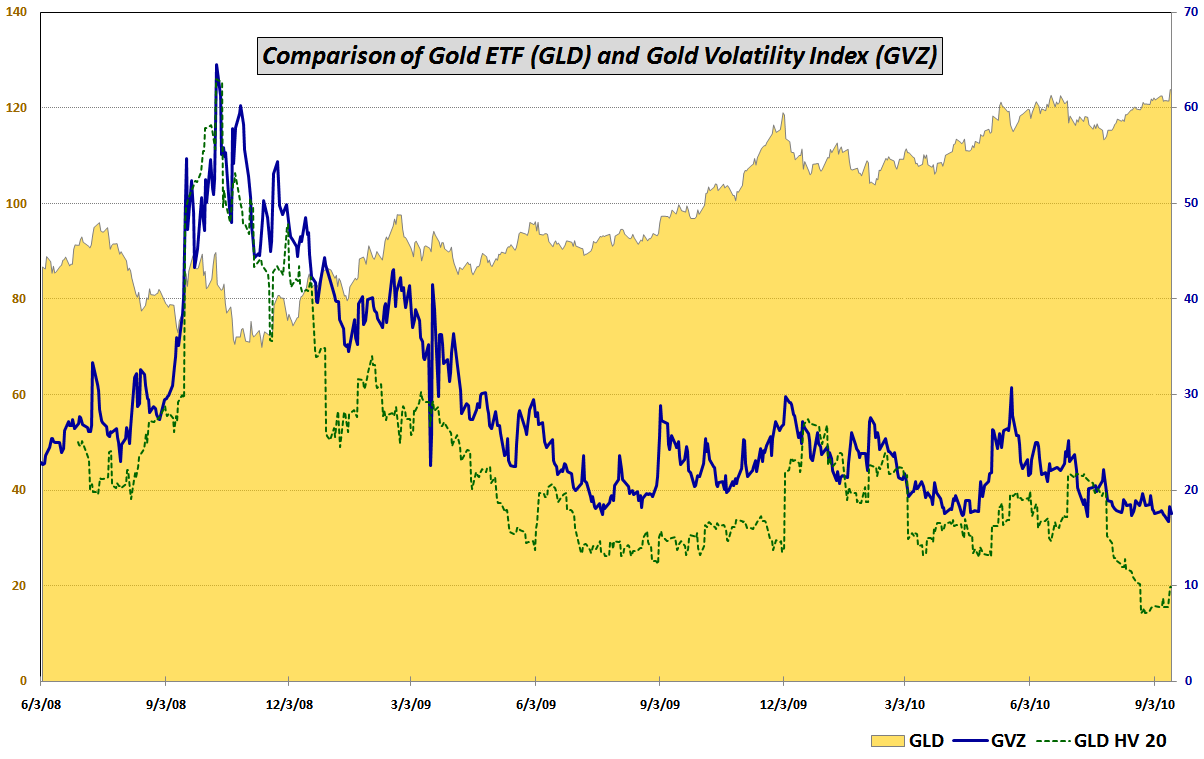
With such strong convictions and emotions riding on the gold trade, this is the type of environment in which one would expect to find extreme volatility. Instead, the exact opposite has been unfolding. As the chart below demonstrates, during the last month the 20-day historical volatility in gold (dotted green line) has dropped to its lowest level in several years. At the same time, the CBOE’s gold volatility index (GVZ), which measures 30-day implied volatility expectations for GLD, has been making all-time lows. GVZ, which has been calculated since June 2008, established a new all-time low on Monday when it closed at 16.69.

With two strong divergent opinions on gold and low implied volatility levels, this could be an excellent time to buy options in order to establish speculative long or short positions in the metal.

In addition to gold’s speculative potential, investors looking for a portfolio hedge or even just a little portfolio diversification might also find gold options to be an attractively priced addition to one’s portfolio at current prices.

Related posts:


[source: CBOE, Yahoo]

Disclosure(s): long GDXJ at time of writing

Sunday, June 20, 2010

Chart of the Week: U.S. Open Scorecards

I was pulled in quite a few different directions when considering this week’s chart of the week. There was the rally in the euro, some positive debt offerings in Spain, new highs in gold, BP’s $20 billion escrow fund, etc. On the volatility front, the last week was the first time ever that the VIX fell more than 15% in consecutive weeks.

Of all the things that stuck in my mind this week, however, the one I found the most compelling was the course the United States Golfing Association assembled this week at Pebble Beach to test the world’s best golfers in the world for the U.S. Open championship.

While this was a relatively short course, the challenges posed by natural obstacles, difficult greens and the U.S. Open’s notoriously long and unforgiving rough were such that not one of the 156 golfers was able to break par. In keeping with tradition, the U.S. Open course was set up to extract the maximum penalty for any missed shot.

In fact, as I see it, the championship was decided not by how many birdies a golfer was able to make, but by how well he was able to avoid trouble. The scorecards of the top three finishers tell the story and together comprise this week’s chart of the week. In the end, the winner, Graeme McDowell, persevered by not allowing the course to bully him into anything worse than a bogey. Runner-up Gregory Havret had only one double bogey on his scorecard, but it was just enough to keep him one stroke back from McDowell. Third place finisher Ernie Els, who plays with the demeanor of someone who is always unflappable, ended up with two double bogeys and finished two strokes back. In the end, it was the disastrous double bogeys – and one’s ability to avoid them – that spelled the difference.

The reason the Pebble Beach odyssey stuck in my mind is that it reminded me that traders should approach trading the way they would approach a golf course like Pebble Beach. The goal should be to play for pars and look to capitalize on any birdie opportunities that arise. To the extent possible, this means keeping the ball away from hazards and obstacles, as well as avoiding low percentage plays. It also means not compounding small mistakes by pressing and trying to make up lost shots in a hurry. Impulsive play is almost always penalized; patience and discipline are the only way to survive.

In golf and in trading, it is better to be able to drive the ball into the fairway than to hit it 300 yards and not control where it is going. Consistency, precision, patience and opportunistic aggression. That is the recipe for winning golf and winning trading – at Pebble Beach or in your own back yard.

For more on related subjects, readers are encouraged to check out:


[source: U.S. Open]

Disclosure(s): none

Sunday, May 23, 2010

Chart of the Week: The Flight-to-Safety Trade

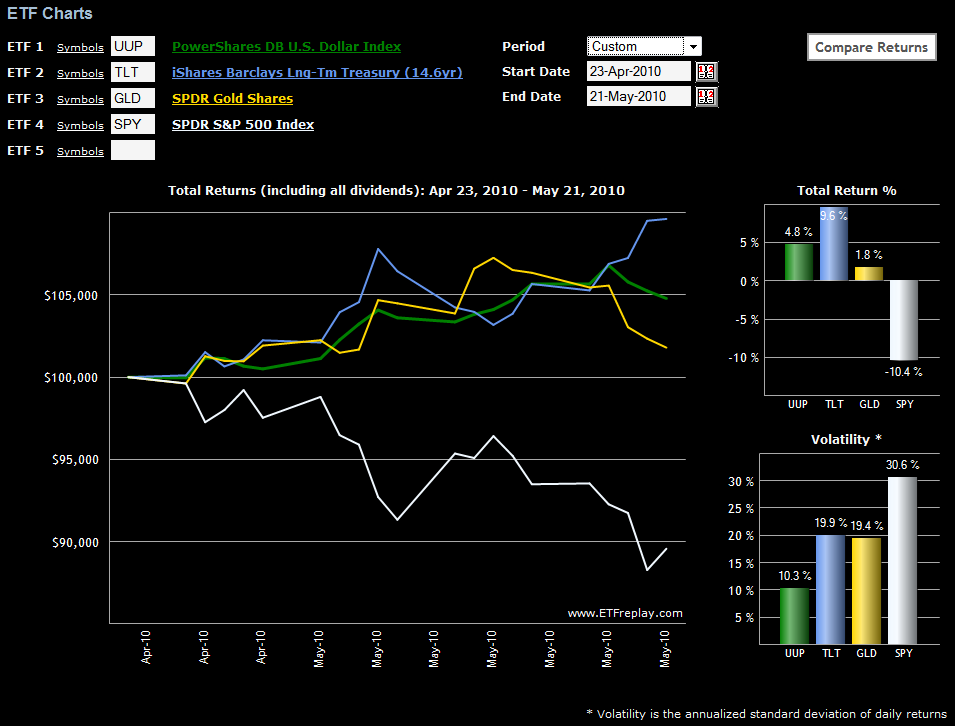
This week’s chart of the week looks at some of the various flight-to-safety trades that investors have been taking advantage of since the recent closing high of 1217 in the S&P 500 index from April 23rd.

In the chart below, note that first gold (GLD) and then the dollar (UUP) peaked as hedges against stock declines. More recently, U.S. Treasuries have been the favored flight-to-safety vehicle, with the long bond ETF (TLT) outperforming the other two alternatives and shorter-term Treasury ETFs such as IEF, not shown, attracting quite a few buyers.

Also not shown in the chart below is VXX (iPath S&P 500 VIX Short-Term Futures ETN), which is more of a hedge than a flight-to-safety alternative. During the last month VXX is up 81.3%, with a volatility level of 113.6.


[source: ETFreplay.com]

Disclosure(s): short VXX at time of writing

Tuesday, September 8, 2009

Recent Developments in Gold and Gold Volatility

With the price of gold topping $1000 per ounce today for the first time since February, there has been a great deal of discussion about gold prices and the volatility of gold prices.

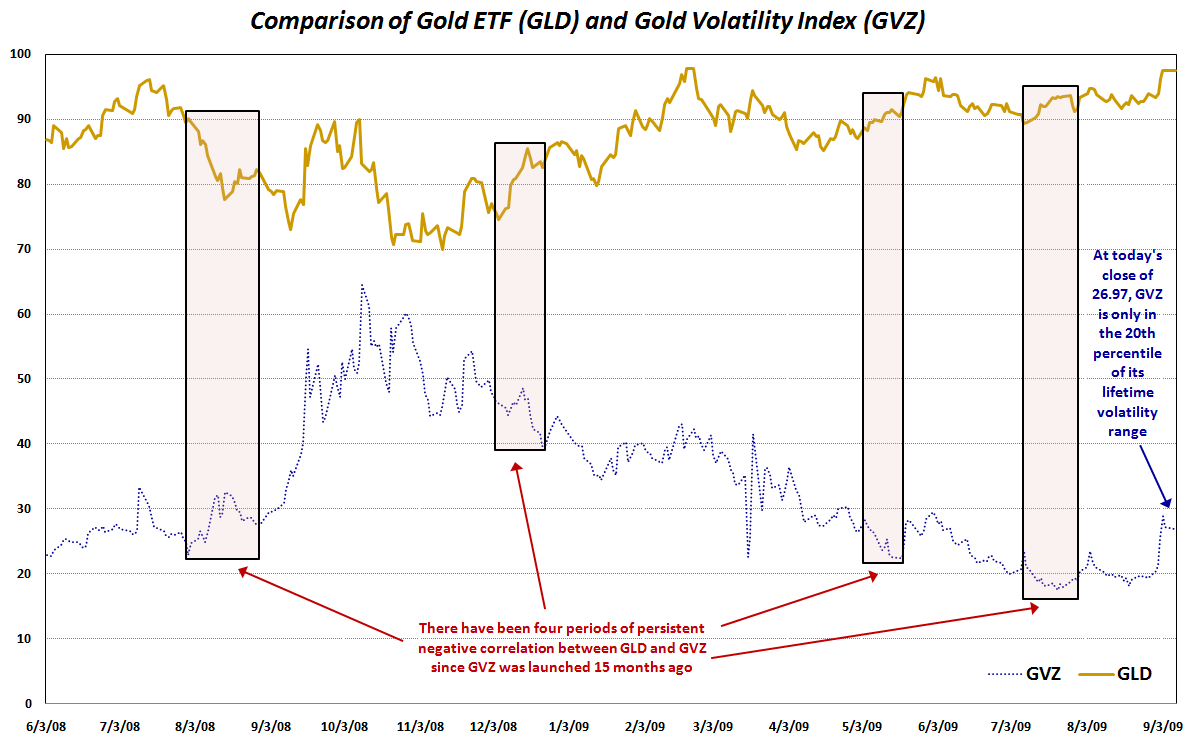
While there is no disputing that gold prices are high (today they also matched their 52 week high), the comments I have seen about elevated volatility in gold are not supported by the numbers. In fact, the CBOE’s gold volatility index (GVZ), which is sometimes known as the “Gold VIX,” closed today at 26.97, which is in just the 20th percentile of the GVZ’s range since the index was launched in June 2008. This means that the implied volatility in the gold ETF (GLD) is not pricing a large move in the commodity in the coming months.

Looking back at historical volatility, the numbers show volatility at historically low levels. A week ago today, for instance, GLD set a new record low for 20-day historical volatility. While historical volatility has risen slightly in the last week, it is still only in the 6th percentile for HV data going back to June 2008.

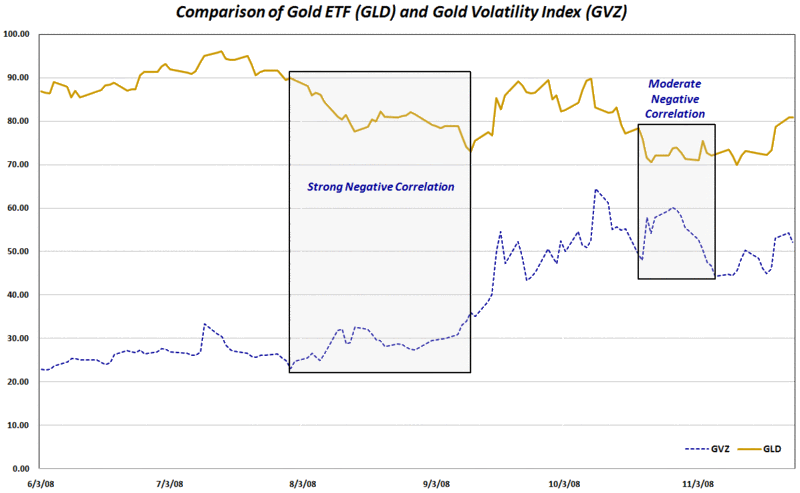
A related, but little discussed phenomenon is the correlation between gold and gold volatility. I track this in several different ways, including using 10-day and 20-day rolling correlations between GLD and GVZ. In each of the last three days, the 10-day and 20-day rolling correlations have set new records, indicating that GLD and GVZ have been moving upward almost in lockstep lately, particularly for the past five trading sessions.

The correlation data do have some interesting historical precedents associated with them. For instance, the last time the 10-day rolling correlations set a new high was at the beginning of June, just as gold was topping out just below 990.

In the chart below, I have captured the movements of GLD and GVZ since the launch of GVZ. In addition, I have also highlighted some of the instances when GLD and GVZ have had a persistent negative correlation in the past.

Sometime in the near future, I will pick up the theme of extreme positive correlations between GLD and GVZ.

For additional posts on gold and gold volatility, readers are encouraged to check out:

Monday, March 2, 2009

Three Fear Indicators (or…The Three Baritones)

While the VIX gets most of the media attention as a fear indicator, its usefulness is clearly much better for volatility related to U.S. equities than it is for other asset classes and economic threats.

The TED spread received considerable acclaim in 2008 as measure of liquidity and a reasonable proxy for counterparty risk. Of course gold had been around the longest of all and has served as a barometer of risk for all types of investments and other risks for centuries.

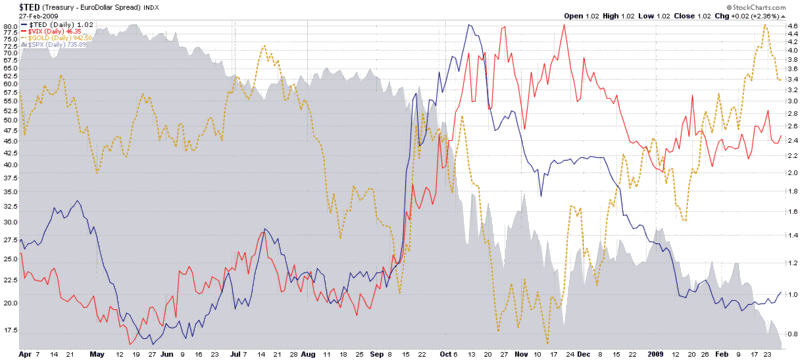
In the chart below, I have overlain the VIX, TED spread and gold against a backdrop of a declining SPX for the past year. Note that the TED spread peaks first among the three, during the second week in October, and subsides rather quickly, as liquidity issues recede to the background. The VIX is next to peak, but it too begins to head down toward the end of November as fears of systemic meltdown slowly begin to subside.

The most interesting line on the chart is that price of gold, which actually bottomed in mid-November and has risen sharply over the past three months, partly as a safe haven for panicky investors, but also as a hedge against the risk of inflation due to various fiscal policy approaches that governments are taking in order to rejuvenate the economy.

In summary, the TED spread has retraced its entire September-October spike, the VIX has retraced about half of its September-November spike, and gold appears to have paused after retracing about 20% of its November-February move. The TED spread and the VIX look like old news at the moment, with the possibility that gold may be the best fear indicator for current market conditions.

[source: StockCharts]

Saturday, February 21, 2009

Chart of the Week: How Much Citigroup for My Gold?

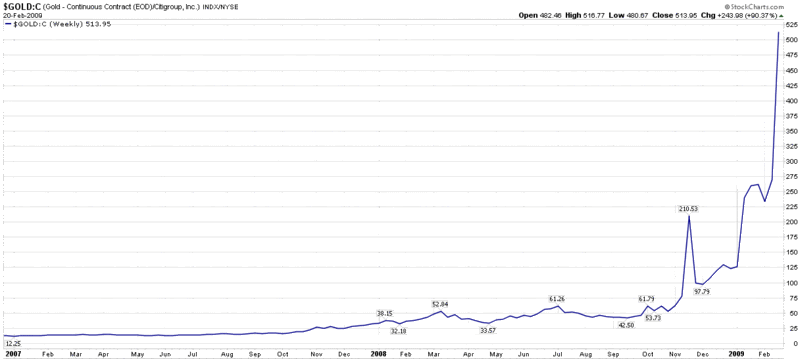
In 2001, an investor who wanted to exchange his gold bullion for Citigroup (C) shares was able to acquire about six shares of stock for each ounce of gold. With Citigroup closing just under 2.00 yesterday and gold above the 1000.00 mark, that same swap now entitles the holder of gold to about 514 Citigroup shares.

The change in fortunes says much less about gold, which is almost 300% above the 2001 lows, than it does about Citigroup, which has fallen about 96% from an early 2007 high.

This week’s chart of the week chronicles the ratio of gold continuous contract futures to the price of Citigroup stock, essentially tracking the exchange rate for Citigroup in gold since the beginning of 2007. In many respects, this chart is also an excellent proxy for the magnitude of the problems facing the U.S. banking system.

[As an aside, now three months old, the full history of the VIX and More Chart of the Week series can be found by following the chart of the week link.]

[source: StockCharts]

Saturday, December 27, 2008

Chart of the Week: Gold

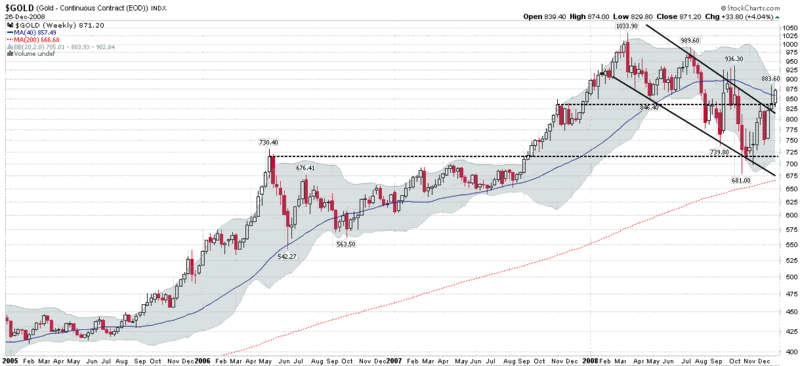
In a week in which most securities drifted lower on uninspired volume, gold was a notable exception, jumping 4.1% as tensions between India and Pakistan increasingly point toward the possibility of a military confrontation while violence in the Gaza Strip between Israel and Hamas is escalating.

Against the backdrop of potential conflict in either Gaza or the India-Pakistan region, gold surged above the critical 840 mark and ended the week at 871. As the uppermost of the two dashed black lines in the chart of the week shows, resistance from previous November-December 2007 highs was pierced this week. Gold also broke out of a down trending channel (solid black lines) this week and is now setting up for a possible large bullish move. If gold continues to rise, look for gold miners (GDX) to be even more volatile and likely outperform the commodity or the popular gold bullion ETF, GLD.

[source: StockCharts]

Wednesday, December 10, 2008

Strange Rally, With Gold and Energy Up, Financials Down

For what it's worth, I'm short right now, as among other factors I am suspicious of a DJIA that is up 187 points largely behind strength in gold and the energy sectors.

Meanwhile, financials are in the red.

Will financials pull the broader market back down? Will commodities lift the market higher?

The more I think about it, the more I think we are moving closer to a deadlock and the more I like that SPX straddle trade...

Wednesday, November 26, 2008

Recent Gold Volatility

I have been receiving quite a few questions about gold and gold volatility lately, so with gold receiving a lot of attention in the press, I thought this would be a good time to check in on the commodity and on the CBOE’s gold volatility index (GVZ), which was launched back in August.

Gold is something every investor should be watching these days as it reflects the ebb and flow of opinions about the risk of deflation in the short run and inflation over the longer run.

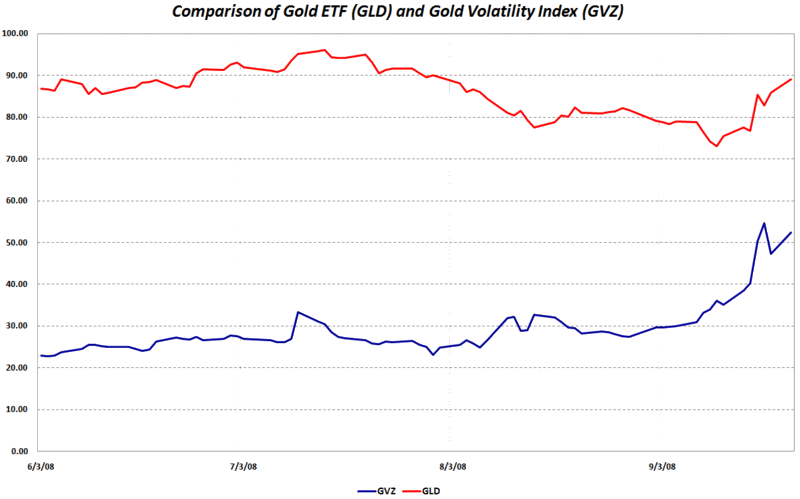
In the chart below, I have captured the price action in the commodity as tracked by GLD, the popular gold bullion ETF. I have also included the GVZ (aka “Gold VIX”) to gauge some of the recent volatility in gold trading. Gold volatility peaked back on October 10th and has been in a gradual downtrend for the past six weeks. The chart reflects that spikes in gold volatility have generally coincided with spikes in the price of the commodity.

The broader issue of correlations between gold prices and volatility is much more complicated and subject to cyclical swings. In the chart I have highlighted two periods in which gold and gold volatility have shown a persistent negative correlation, first in August and later in mid-October. These two instances were both bearish for gold prices, yet when the correlation switched back to a positive one, gold prices began to move up in both instances.

It is still too early to draw any definitive conclusions between gold prices and gold volatility, but I will return to this subject periodically as my thinking evolves on the subject.

[source: VIX and More]

Tuesday, September 23, 2008

Gold and Gold Volatility

With the unfolding of the latest chapters in the financial crisis, gold has received considerable attention as a safe haven investment. The rush into gold was greatly exacerbated when investors began to lose confidence in money market funds following the ‘breaking of the buck’ at Reserve Primary Fund last Tuesday.

One week later, there is still a great deal of fear and anxiety in the financial markets and gold is trading at its highest level in almost two months.

In the chart below, I have plotted the movements of GLD, the most popular gold ETF, along with GVZ, the CBOE’s gold volatility index (or Gold VIX) which was launched back on August 1st and is based on GLD.

As is the case with OVX (CBOE oil volatility index), there has generally been a positive correlation between the price of gold and gold volatility index. Note that in early August, the correlation between GLD and GVZ switched from positive to negative, as gold volatility began to rise even as gold prices declined. On about September 11th, however, the correlation between GLD and GVZ swung back to a strong positive one, where it has held for the past two weeks. It may just be a coincidence that this switch in correlation occurred just before a week of extreme financial panic, but I wanted to at least plant that seed and note that I will be following these and other related subjects as I evaluate some of the new volatility indices in this space going forward.

[source: VIX and More]

Wednesday, May 21, 2008

Gold vs. Oil

Peak Oil or not, crude has had an incredible run as of late. If you have any doubt about how sharp the move has been, check out Tim Knight’s Elliott wave count and chart at The Slope of Hope.

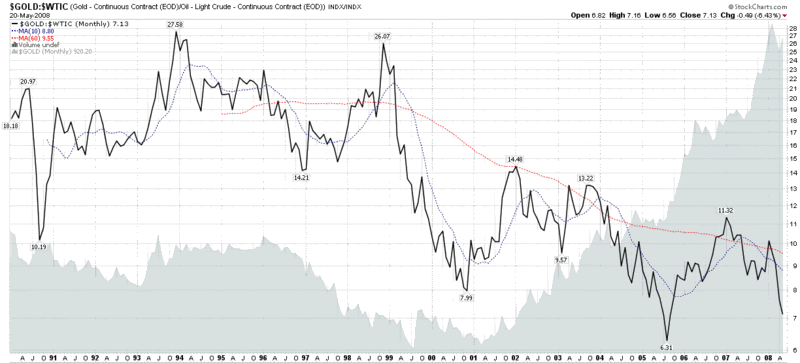
As the chart below shows, gold has had quite a run too (see the area chart), but lately oil has been outperforming gold. One way to interpret this ratio chart is to think of what an ounce of gold would cost if it were priced in barrels of oil. As anyone who has been to Dubai lately can tell you, it is taking less and less oil to buy an equivalent amount of gold these days.

There was a time when a house was considered to be one of the best hedges against inflation. Clearly that is not the case at the moment – at least in the US. Gold has historically been an even better inflationary hedge, but lately oil has outpaced gold in that area. The oil trade is very crowded at the moment and when oil turns down, there will still be many who are seeking alternative hedges against inflation. Don’t be surprised if a lot of that oil money flows into gold and sends the gold to oil ratio back toward historical norms.

DISCLAIMER: "VIX®" is a trademark of Chicago Board Options Exchange, Incorporated. Chicago Board Options Exchange, Incorporated is not affiliated with this website or this website's owner's or operators. CBOE assumes no responsibility for the accuracy or completeness or any other aspect of any content posted on this website by its operator or any third party. All content on this site is provided for informational and entertainment purposes only and is not intended as advice to buy or sell any securities. Stocks are difficult to trade; options are even harder. When it comes to VIX derivatives, don't fall into the trap of thinking that just because you can ride a horse, you can ride an alligator. Please do your own homework and accept full responsibility for any investment decisions you make. No content on this site can be used for commercial purposes without the prior written permission of the author. Copyright © 2007-2023 Bill Luby. All rights reserved.
 
Web Analytics