Showing posts with label GDX. Show all posts

Sunday, September 26, 2010

Chart of the Week: Gold and the Miners

From a technical perspective, the big event in the markets in the last week is undoubtedly the breakout in the S&P 500 index, but since I devote so much time to the SPX and its derivatives, I thought the time is ripe to recognize gold for hitting a new all-time high and bumping up against $1300 per ounce.

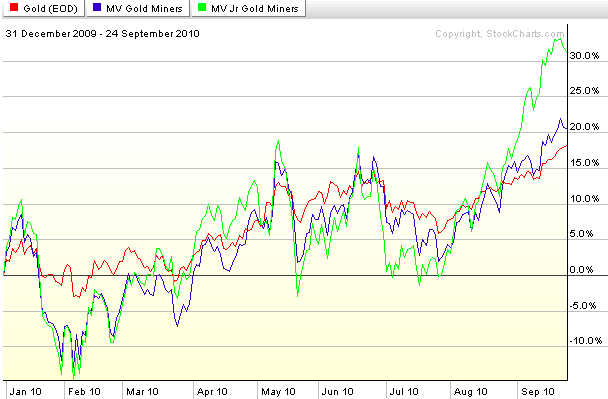
To put a slightly different spin on gold, in the chart of the week below I have elected to include the gold futures continuous contract (red line) and also two popular ETFs for gold miners: GDX, the large cap version (top holdings of ABX, GG and NEM), shown below in a blue line; and GDXJ, the junior gold miners ETF (green line.)

As the chart of 2010 performance shows, gold futures have been the least volatile of the group and have had about the same performance as GDX. While GDX and GDXJ track each other fairly closely, note that GDXJ has distinguished itself with superior performance over the course of the last month or so.

Predicting the future of gold is a daunting task, but if the bullish trend continues, GDXJ clearly has the potential to continue to deliver outsized returns – with commensurate risk, of course.

Related posts:


[source: StockCharts.com]

Disclosure(s): long GDXJ at time of writing

Thursday, September 16, 2010

Opportunities Arising from Unusually Low Implied Volatility in Gold

Gold sure seems like it has been acting more than a little crazy lately, with the commodity recently hitting new highs and threatening the 1300 level and ETFs for physical gold (e.g., GLD) and gold miners (e.g., GDX, GDXJ) attracting a great deal of attention.

If you listen to the media, a number of extreme positions are being bandied about, ranging from gold going to 10,000 to being described yesterday as the “ultimate bubble” by billionaire hedge fund guru George Soros.

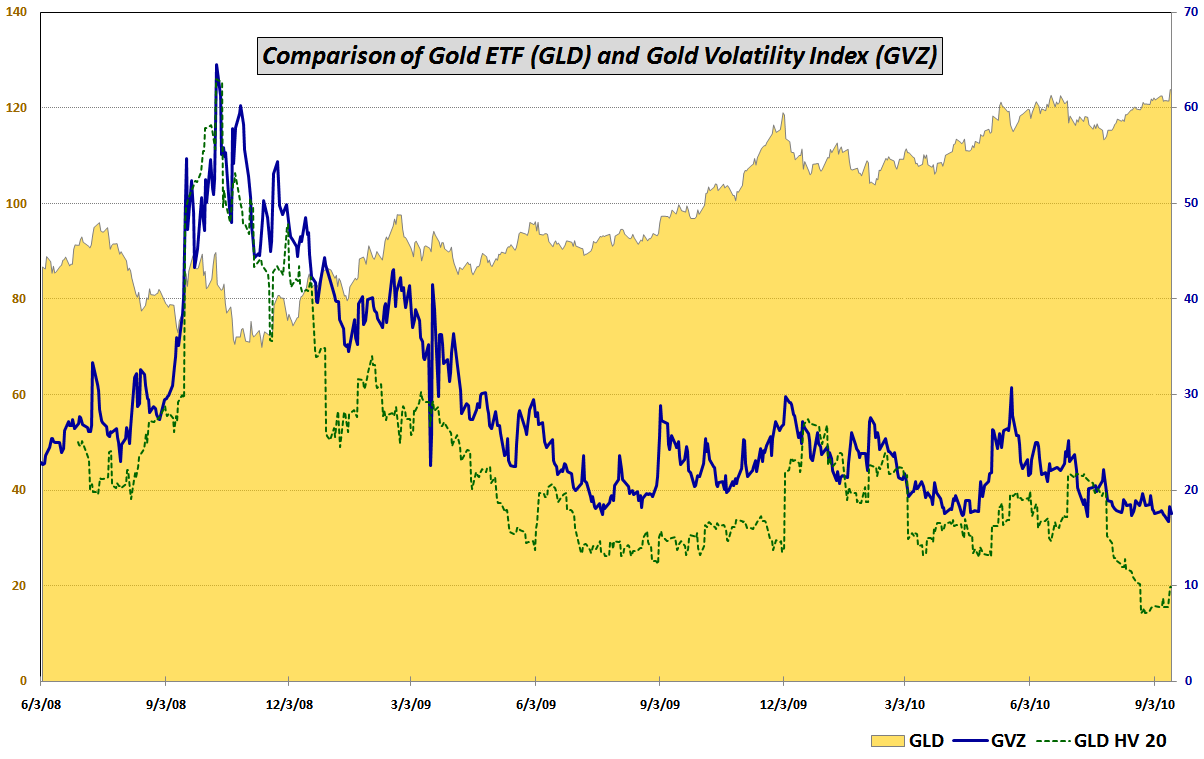
With such strong convictions and emotions riding on the gold trade, this is the type of environment in which one would expect to find extreme volatility. Instead, the exact opposite has been unfolding. As the chart below demonstrates, during the last month the 20-day historical volatility in gold (dotted green line) has dropped to its lowest level in several years. At the same time, the CBOE’s gold volatility index (GVZ), which measures 30-day implied volatility expectations for GLD, has been making all-time lows. GVZ, which has been calculated since June 2008, established a new all-time low on Monday when it closed at 16.69.

With two strong divergent opinions on gold and low implied volatility levels, this could be an excellent time to buy options in order to establish speculative long or short positions in the metal.

In addition to gold’s speculative potential, investors looking for a portfolio hedge or even just a little portfolio diversification might also find gold options to be an attractively priced addition to one’s portfolio at current prices.

Related posts:


[source: CBOE, Yahoo]

Disclosure(s): long GDXJ at time of writing

Saturday, December 27, 2008

Chart of the Week: Gold

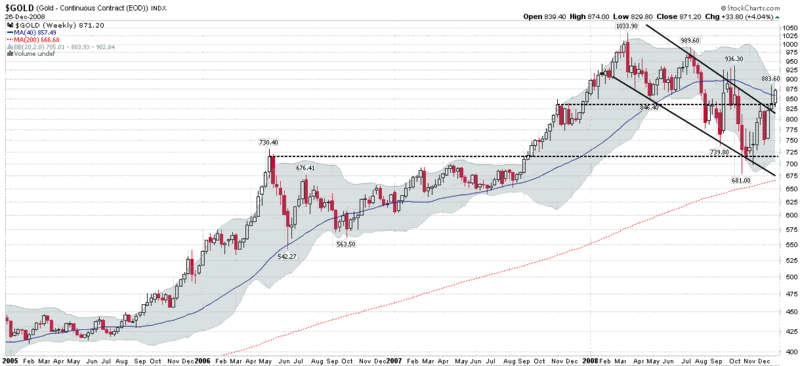
In a week in which most securities drifted lower on uninspired volume, gold was a notable exception, jumping 4.1% as tensions between India and Pakistan increasingly point toward the possibility of a military confrontation while violence in the Gaza Strip between Israel and Hamas is escalating.

Against the backdrop of potential conflict in either Gaza or the India-Pakistan region, gold surged above the critical 840 mark and ended the week at 871. As the uppermost of the two dashed black lines in the chart of the week shows, resistance from previous November-December 2007 highs was pierced this week. Gold also broke out of a down trending channel (solid black lines) this week and is now setting up for a possible large bullish move. If gold continues to rise, look for gold miners (GDX) to be even more volatile and likely outperform the commodity or the popular gold bullion ETF, GLD.

[source: StockCharts]

DISCLAIMER: "VIX®" is a trademark of Chicago Board Options Exchange, Incorporated. Chicago Board Options Exchange, Incorporated is not affiliated with this website or this website's owner's or operators. CBOE assumes no responsibility for the accuracy or completeness or any other aspect of any content posted on this website by its operator or any third party. All content on this site is provided for informational and entertainment purposes only and is not intended as advice to buy or sell any securities. Stocks are difficult to trade; options are even harder. When it comes to VIX derivatives, don't fall into the trap of thinking that just because you can ride a horse, you can ride an alligator. Please do your own homework and accept full responsibility for any investment decisions you make. No content on this site can be used for commercial purposes without the prior written permission of the author. Copyright © 2007-2023 Bill Luby. All rights reserved.
 
Web Analytics