Showing posts with label EVZ. Show all posts

Sunday, November 20, 2016

Post-Election Risk Trending Up in Treasuries and the Euro, Down in U.S. Stocks

You can always tell when the crowd gets long the VIX and ends up on the wrong side of the trade.  “The VIX is broken!” becomes an oft-repeated refrain, as does “The markets are rigged!” and the usual list of exhortations from those who are in denial.  The current line of thinking is that the world must be much more dangerous, risky and uncertain as a result of a Trump victory, yet the VIX is actually down 31.4% since the election – ipso facto the VIX is broken.

While I have more than a small soft spot in my heart for the VIX, I will be the first to point that taking an Americentric, equity-centric view of the investment landscape is dangerous and naïve.  More often than not, the issues that end up having a strong influence on the VIX are born on foreign soil and/or in other asset classes.  Just look at the recent history in China, Greece, Italy, currencies and commodities to name a few.

When it comes to looking at implied volatility indices as a risk proxy, I prefer to survey the landscape across asset classes, geographies and sectors, which is why I have developed tools such as a proprietary Macro Risk Index (more on this shortly) that look at risk across asset classes, geographies and sectors.

In the graphic below, I have isolated a handful of volatility indices that cut across asset classes and geographies to show how these have moved in the eight days following the election.  Note that Treasuries (TYVIX) and the euro (EVZ) have been trending steadily higher since the election as uncertainty related to the future of inflation and interest rates in the U.S. has risen, while the relationship that the Trump Administration will have with our NATO allies and the European Union is also somewhat murkier. 

Gold implied volatility (GVZ) initially moved sharply higher following the election, but has since receded, as gold prices fell swiftly after the election, but have since stabilized.  Meanwhile, emerging markets saw dramatic selling immediately following the election, but have bounced during the course of the past week as fears and implied volatility (VXEEM) have subsided.  Last but not least, the moves in crude oil and crude oil implied volatility (OVX) have been the least remarkable of the group


[source(s):  CBOE, VIX and More]

In aggregate, the picture is a mixed one in terms of implied volatility, risk and uncertainty.  As is often the case, risk has become elevated in certain asset classes, such as Treasuries and the euro.  In other areas, such as U.S. equities – and their VIXian barometer – there are winners and losers, with the result that a net bullish outlook has moved equity implied volatility lower.  This is not to say that a Trump Administration – whose cabinet members and policy priorities are largely unknown at this juncture – will not increase risk in some areas.  More risk is certainly on the horizon and if history is any guide, an Americentric, equity-centric view of the investment world is likely to be slow in identifying those risks.

Related posts:


For those who may be interested, you can always follow me on Twitter at @VIXandMore


Disclosure(s): the CBOE is an advertiser on VIX and More

Tuesday, July 16, 2013

Guest Columnist at The Striking Price for Barron’s: How to Spot Risk Early

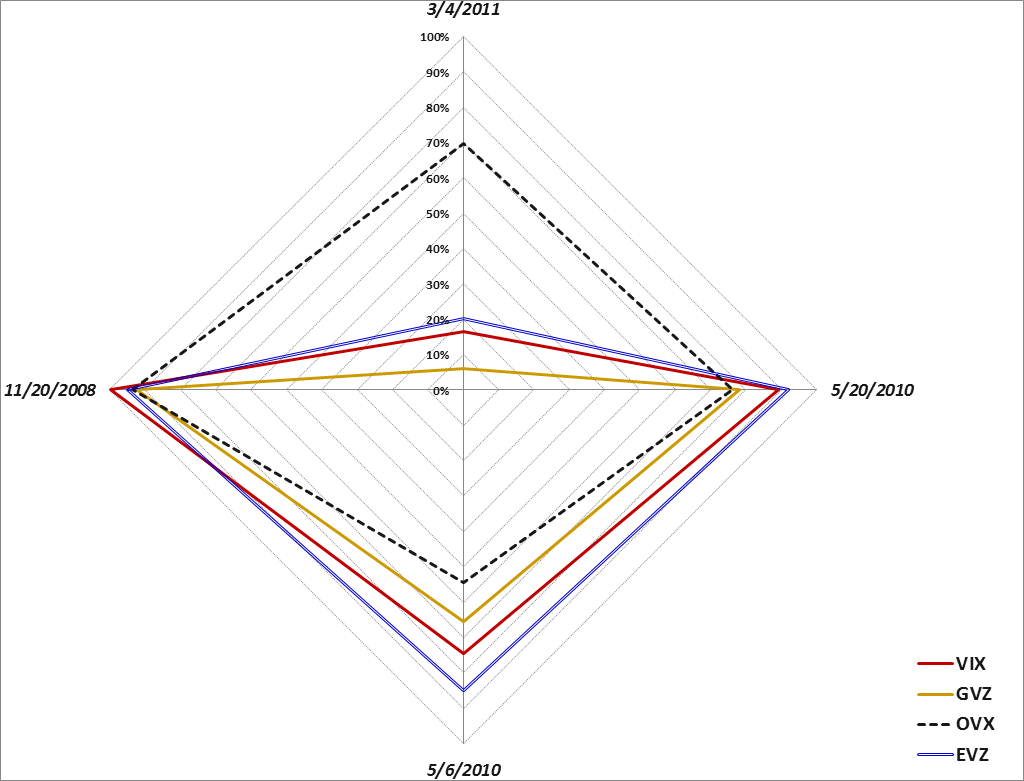
Today’s guest column, How to Spot Risk Early, at The Striking Price on behalf of Steven Sears at Barron’s, is the eleventh time I have had the opportunity to write a column for Barron’s. Today’s column picks up on a theme I addressed in a March 2011 article in Expiring Monthly which was titled, Evaluating Volatility Across Asset Classes. In that 2011 article, I introduce the concept of a volatility compass as a framework for evaluating the different types of volatility spikes that were seen in the 2008 financial crisis, the euro zone crisis as of May 2010, the Arab Spring in March 2011, and the May 6, 2010 flash crash.

[Volatility compass showing different levels of volatility across asset classes during four recent spikes in volatility. Source(s):VIX and More]

In the 2011 article I provide an overview of my thinking as follows:

“It is my belief that a better understanding of the volatility picture across asset classes will yield a better grasp of volatility events and help to identify a number of favorable trading setups.”

Later on I conclude the article with the following thoughts:

“For those who have studied sector rotation strategies and methods for trading geography-based ETFs, some of the analytical techniques used in those two disciplines can be carried over to an analysis of cross asset class volatility.

Ultimately, the study of volatility has both a science and art component to it, but a cross asset class approach provides a more broad-based holistic view of the volatility landscape and adds a little more science to the mix.

At some point, volatility becomes the study largely of contagion and falling dominoes. I can say without hesitation that a multi-disciplinary approach is essential to understanding contagion and dominoes and that a cross asset class analytical framework supplemented by tools such as the volatility compass is an effective way to approach that subject.”

In today’s Barron’s article, I expand upon the idea of four types of volatility indices and address volatility indices that provide a snapshot of geographical uncertainty and risk as well as broader measures of uncertainty and risk across asset classes such as U.S. Treasury Notes and currencies.

I will have more on this subject in the future, but for those interested in researching some of these subjects, I have highlighted some previous posts on different ways of thinking about uncertainty, risk and volatility below.

Related posts:

A full list of my Barron’s contributions:

Disclosure(s): none

Wednesday, October 31, 2012

EuroCurrency Volatility Index (EVZ) at Lowest Level Since March 2008, Diverges from VIX

Since its launch in August 2008, the CBOE EuroCurrency Volatility Index (ticker EVZ, sometimes known simply as the “euro VIX”), which is based on the FXE ETF, has toiled in relative obscurity compared to some of the more famous volatility indices.

Given all the fears about the European sovereign debt crisis over the past few years, I find the lack of interest in EVZ to be surprising. After all, in thinking about the euro zone one of the most basic questions has been whether or not the euro will survive.  Further, outside of the U.S. at least, the future of the euro zone is still considered to be the biggest risk to the stock market.

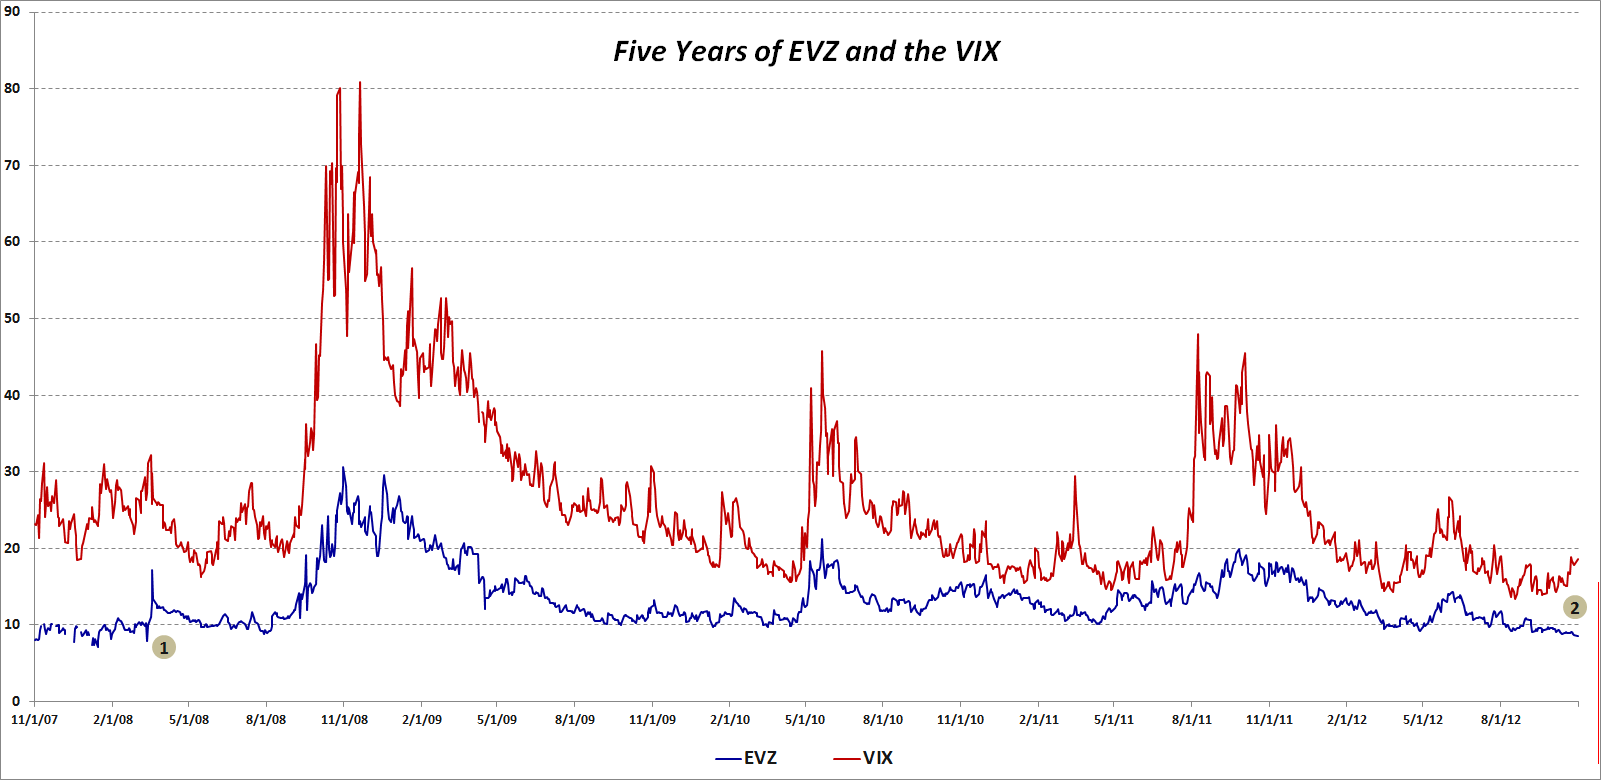
With all this in mind, I was looking at EVZ data this evening and discovered that today marks five years since the beginning of the historical EVZ data provided by the CBOE (reconstructed data fills the gap from November 2007 to the August 2008 launch.)

The chart below shows the history of closes in EVZ (blue line), as well as comparative closing prices for the VIX (red line.) I have annotated the chart to highlight two pieces of information:

  1. The last time that EVZ closed lower that it did today (8.55) was in March 2008, just before Bear Stearns collapsed and was sold to JP Morgan (JPM)
  2. The recent divergence between a falling EVZ and a rising VIX, which dates from the middle of September, is unusual, particularly given the length of the divergence

So…is EVZ understating the risk to the euro or is the VIX overstating the risk to stocks? Is it possible that these two measures of risk can be moving in opposite directions and both be right?

Related posts:

[source(s): CBOE]

Disclosure(s): none

Thursday, June 28, 2012

The Evolution of European Equity Risk

There are many ways in which investors can evaluate risk related to the euro zone. Credit default swaps for sovereign debt are one way to evaluate the risk of country default. Sovereign bond yields are a good proxy for a country’s access to funding via the credit markets. The euro crosses and related directional moves are a barometer of the strength of the currency and the euro zone countries as a whole, while various Intrade contracts can lend a sense of the probabilities that investors assign to various events, such as to the risk of one or more countries dropping the euro.

On the volatility side, the VSTOXX (EURO STOXX 50 Volatility Index) the EVZ (CBOE EuroCurrency Volatility Index) provide a market assessment of risk and uncertainty in euro zone stocks as well as the currency.

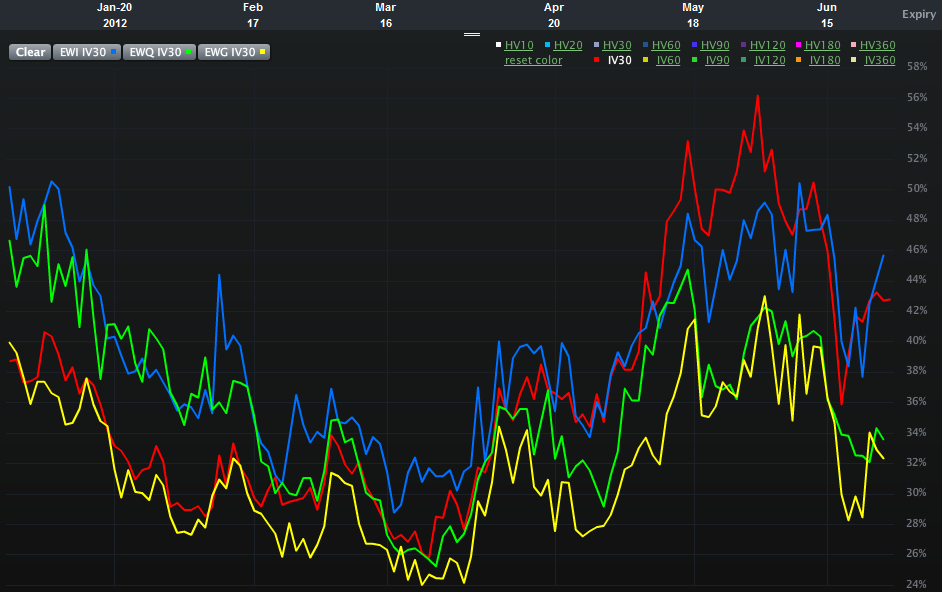
One piece of analysis I have not seen, however, is an assessment of the relative risk and uncertainty for equity markets in some of the more important euro zone nations. Specifically, Spain, Italy, France and Germany. The chart below attempts to offer up that very information, using 30-day implied volatility for the various country ETFs over the course of the past six months:

  • EWP – Spain (red line)
  • EWI – Italy (blue line)
  • EWQ – France (green line)
  • EWG – Germany (yellow line)

Looking at the chart, what initially catches my eye is the recent evolution of the two-tiered risk system. In the first half of the year, the higher risk is clearly associated with Italy and France, whereas Spain and Germany appear to be considerably less risky in terms of implied volatility. By the March the risk appears to have lessened across the board and the distinctions between individual countries is more difficult to discern. Over the course of the last 1 ½ months or so, a new two-tiered system has appeared. This time around it is Italy and Spain where the risk to equities is considered to be the greatest, with France now joining Germany in the lower risk tier.

In essence, Italy has persisted in the high risk tier and Germany has been a constant in the lower risk category. Over the course of the past few months, the interesting development has been the switch between France and Spain, with the former improving from being a peer of Italy to a peer of Germany, while Spain has moved in the opposite direction.

One could certainly argue that all four countries are in the same boat (taking on water, with shoddy life preservers, in shark-infested waters and being one small mutiny away from having no captain…), but clearly investors think there are important distinctions to be made in terms of equity risk and uncertainty. Perhaps of more interest, these fortunes appear to be shifting, with little perceptible difference not just between Spain and Italy, but also between Germany and France.

Related posts:

[source(s): LivevolPro.com]

Disclosure(s): Livevol is an advertiser on VIX and More
Wednesday, June 27, 2012

Euro Volatility and Risk

With the euro zone summit looming, investors are scrambling to find all sorts of measuring sticks to evaluate the risks of a sharp move in the financial markets. Based on some of the emails I have received, many are skeptical of the VIX right now, which is trading in the mid 19s, some 5% below its lifetime mean. At 27.54, the VSTOXX (EURO STOXX 50 Volatility Index) is showing much more uncertainty, but even that number is low relative to the range of the VSTOXX for the past three months.

Whether Spain, Italy or Greece is the fixation du jour, the questions investors really want answers to ultimately all cluster around the future of the euro. I have addressed this question relative to the risk of one or more countries leaving the euro in the context of various Intrade contracts (see links below), but another overlooked manner of measuring risk and uncertainty in the euro is the CBOE EuroCurrency Volatility Index (EVZ). Sometimes referred to as the “euro VIX,” EVZ uses the VIX methodology to measure the market’s expectations of future volatility in the euro. In theory, therefore, EVZ should also be a proxy for risk and uncertainty in the euro. One might even go as far as to consider EVZ as a euro zone fear indicator.

So what is a chart of EVZ telling us on the eve of another euro zone summit?

The chart below shows that at 11.27, EVZ is currently in the lower portion of its range of 9.23 – 20.34 for the past year. Indeed EVZ is only in the 18th percentile of the range of values over the course of the past year. Also of interest, the current 20-day historical volatility of EVZ (60) is lower than the 180-day historical volatility measure (65) – as has been the case for the majority of the last six months. Last but not least, EVZ has been on a notable downtrend since June 18th.

Headlines aside, traders do not see a lot of currency risk in the euro right now, at least relative to the last year or so and as far as the 30-day forward-looking window defined by EVZ is concerned.

So if you think the VIX is depressed and understating market risk, don’t expect the EVZ to be signaling something different. Currency risk and uncertainty seem surprisingly low at current levels. If you think the market has underpriced the potential for a large move in the euro, then consider some long straddles on the euro or its ETF counterpart, FXE.

Related posts:

[source(s): LivevolPro.com]

Disclosure(s): Livevol is an advertiser on VIX and More
Monday, May 14, 2012

Handicapping the Chances of Greece Dropping the Euro

Understanding all the moving parts in the European sovereign debt crisis can be a Herculean task, even for the most determined analyst. Heck, even hazarding a guess at what tomorrow’s crisis du jour will be is more than enough for most investors to grapple with.

In the case of Greece, with an ever-changing political party landscape and fickle voters who intend to distort that landscape even more, trying to assign probabilities to various scenarios and then divine the implications for Greece’s relationship with the euro is sufficiently daunting as to cause many an investor just to park their money in cash until the future begins to look a little less murky.

For some aspects of the euro zone fiasco, there are financial instruments and measures that can serve as a barometer of how bad things are now and are likely to become in the future. Credit default swaps are an excellent example, as is the VSTOXX equity volatility index, the euro volatility index (EVZ), sovereign debt yields, etc.

As far as the euro is concerned, the EVZ is relatively subdued at the moment. Over the course of its life (which began in November 2007), EVZ has typically traded at just a shade over half of the VIX, which is where it closed today. Still, while the VIX posted its highest close since January, EVZ was substantially higher during January, February and the beginning of March.

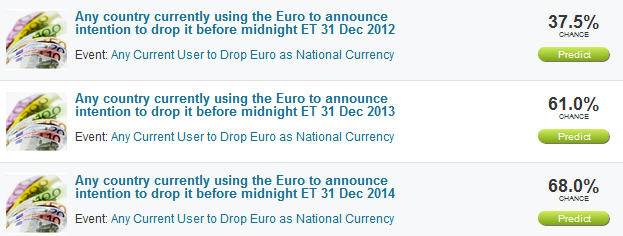
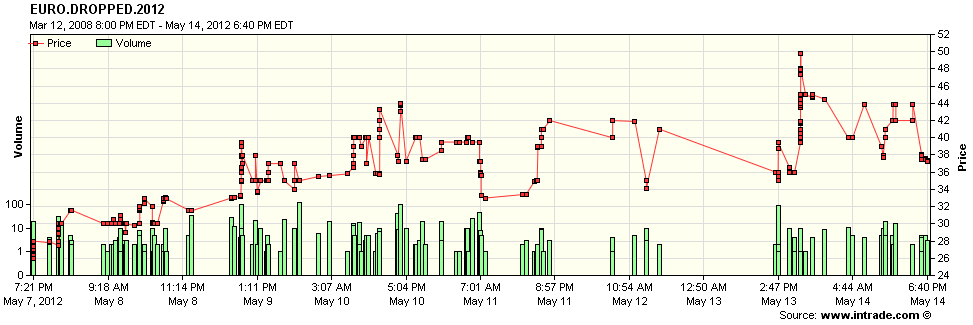
It is at times like this when I find myself paying more attention to the various Intrade prediction markets contracts. In the case of the euro, Intrade has three separate contracts based on the possibility that a euro zone member announces it will stop using the euro as its national currency. The three contracts have expiration dates of the end of 2012, 2013 and 2014 and currently indicate (see top graphic below) that the probability of any euro zone country announcing it will drop the euro is 37.5% by the end of 2012, 61% for the end of 2013 and 68% for the end of 2014.

In addition to the probabilities derived from the price of these prediction market contracts, the trend also bears watching. The bottom graphic shows trades in the 2012 contract. Much to my surprise, sentiment that Greece (or any other country) will exit the euro this year apparently peaked (for now, at least) yesterday afternoon, and pulled back somewhat today, in choppy trading. For those who wish to watch this contract on a tick by tick basis, try the Advanced Charts option and click the Time and Sales radio button. Note that it is also possible to set alerts for this contract.

This seems like a good place to reiterate that I believe Intrade contracts, while helpful, are far from perfect. Still, if your talents do not include four dimensional euro zone dominoes in Greek, these prediction contracts can be a great shorthand for determining how certain events are likely to play out.

Related posts:

[source(s): Intrade.com]

Disclosure(s): none

Friday, December 30, 2011

CBOE To Launch Futures on Emerging Markets Volatility (VXEEM)

One of the predictions I made for 2011 was that the trend toward what I have labeled “atomic volatility” (a lessening of the scope of the underlying for options contracts and/or the duration of those contracts) would accelerate.

Back in March 2011, the CBOE helped to usher in the atomic volatility era when they rolled out volatility indices using the VIX methodology for six sector and geography ETFs:

  • iShares MSCI Emerging Markets Index Fund (VXEEM)
  • iShares Trust FTSE China 25 Index Fund  (VXFXI)
  • iShares MSCI Brazil Index Fund  (VXEWZ)
  • Market Vectors Gold Miners Fund (VXGDX)
  • iShares Silver Trust (VXSLV)
  • Energy Select Sector SPDR (VXXLE)

Later in March, the CBOE rolled out futures based on the gold volatility index (GVZ), which was launched back in August 2008, at the same time as the euro volatility index (EVZ) and several weeks after the launch of the OVX, known affectionately as “the Oil VIX.” [Those who are interested in the sequencing of the launch of various volatility measures should refer to The Evolution of the Volatility Index Family Tree.]

Now the CBOE is taking the next step with VXEEM, the volatility index that is based on the popular emerging markets ETF (EEM), and offering futures on that index. The launch of these futures contracts is set for January 9th and will initially include contracts with expirations in February, March, April and May. Note that the expiration cycles for these contracts are the same as those for the VIX futures and options, meaning that they will expire on Wednesdays (February 15, March 21, April 18 and May 16) and can last be traded on the Tuesday immediately following the expiration. For more information, check out the CBOE’s VXEEM splash page and information circular.

One of the reasons I think products based on EEM and VXEEM have a good chance of being successful is that emerging markets are typically a highly volatile area – much more so than the basket of stocks included in the S&P 500 index on which the VIX is based. Right now, for instance, EEM has a 60-day historical volatility that is more than 50% higher than that of the SPX. All this means that short-term traders should find VXEEM products (futures as well as options and ETPs, assuming they are in the pipeline) to be the types of high-octane trading vehicles that are well-suited to some of their favorite strategies, much like leveraged ETPs and VIX-based products.

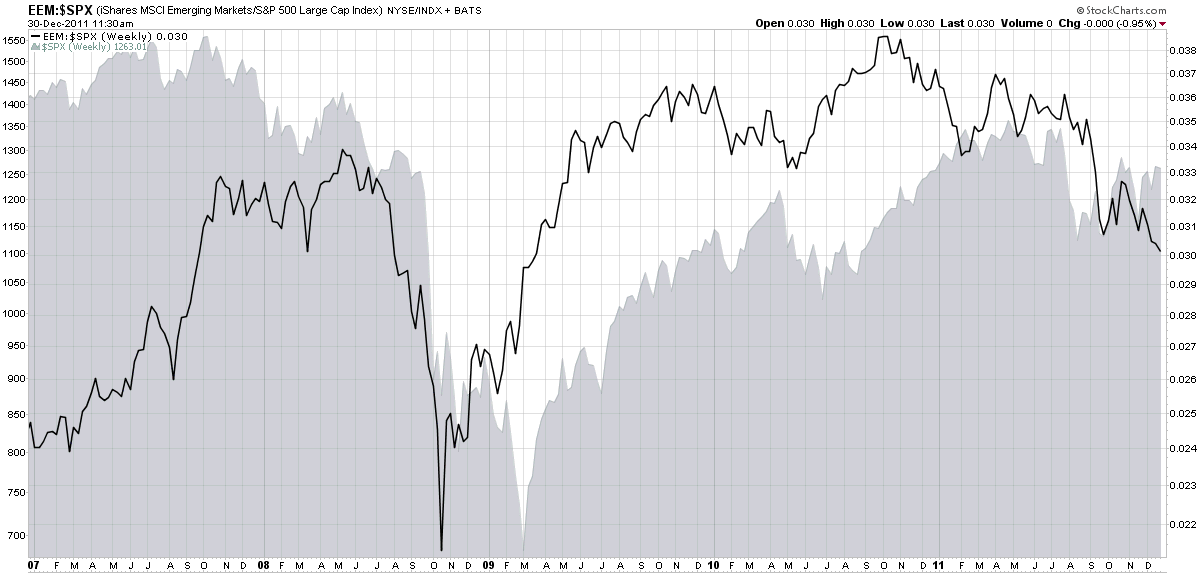
Additionally, as the chart below reminds us, emerging markets sometimes move in cycles that are distinct from U.S. stocks. Note that the ratio of EEM to SPX has varied wildly over the course of the past five years and has had different bottoms and tops than the SPX has. Whether this phenomenon will continue into the future (influenced strongly by China) remains to be seen, but the role of emerging markets relative to developed markets should be watched closely in 2012.

Related posts:

[source(s): StockCharts.com]

Disclosure(s): none

Monday, December 12, 2011

The Low Fear Selloff

Steven Place of Investing with Options has a video post up this morning, Options Market Does Not Care About Selloff, in which he discusses how the implied volatility in various asset class volatility indices (VIX, GVZ, EVZ) are showing a very muted reaction to today’s selloff in stocks.

As noted here previously, the VIX generally moves about -4x in percentage terms the direction of the SPX. Mondays generally see a slightly larger move in the VIX relative to the SPX (usually an incremental 0.5% - 1.0% increase over Friday’s close) due to calendar reversion or the weekend effect, so today one would expect to see the VIX moving at least 4x in the opposite direction of the SPX.

In fact, as I type this the SPX is down about 1.9% on the day and the VIX is up only 3.9% -- so the VIX is about half as sensitive to changes in the SPX that is typical for a Monday trading session.

This is not to say that investors are oblivious to the risk that remain in Europe (and elsewhere) or that today’s move is just a head fake by stocks, but it does mean that the consensus expectations for immediate downside risk are quite low.

Santa may pay a visit after all, assuming he manages to survive all the austerity measures that I am certain his government has saddled him with…

Related posts:

Disclosure(s): none

Monday, August 4, 2008

The Evolution of the Volatility Index Family Tree

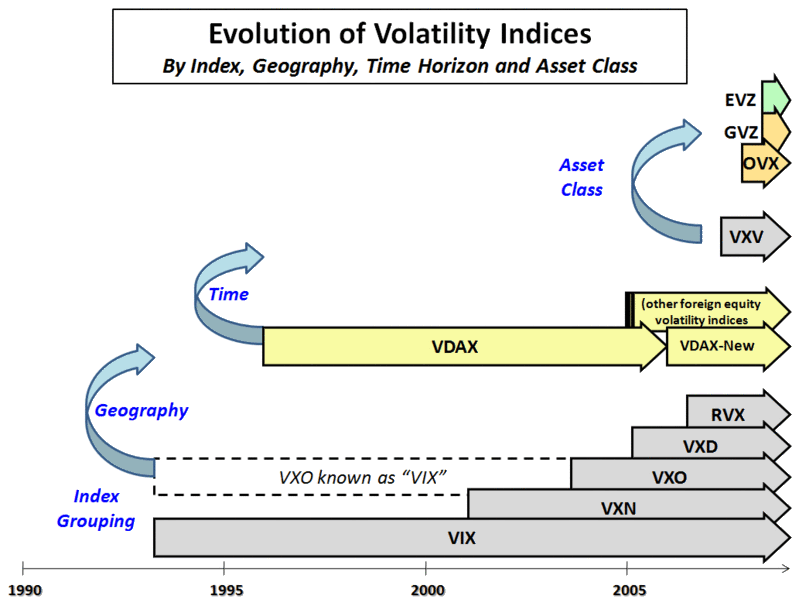
In the beginning, there was the VIX. Eventually, the reach of the VIX was deemed too narrow and the volatility index universe was expanded to include the VXN, VXO, and a host of other volatility indices based on various U.S. equity indices. First an American phenomenon, volatility indices soon began sprouting up overseas, notably in the form of the German VDAX, but more recently reaching Asian shores with the April launch of the India VIX.

Having expanded geographically, volatility indices also recently began to expand the time horizon in which they evaluated volatility with the launch of the VXV, the 93 day version of the VIX.

In the last three weeks, the CBOE has started moving past equity-based volatility indices into commodity and currency volatility indices. The OVX (“Oil VIX”) was the first such effort. Last Friday the CBOE launched two new volatility indices:

  • GVZ – CBOE Gold Volatility Index (“Gold VIX”), based on the GLD ETF

  • EVZ – CBOE EuroCurrency Volatility Index (“Euro VIX”), based on the FXE ETF

The graphic below summarizes some of the highlights across the volatility index evolutionary timeline.

It remains to be seen whether the VIX branding and labeling will stick to oil, gold and the euro. Five years ago, the VIX label was transported from the S&P 100 (OEX) to the S&P 500 (SPX), but until the past few months there has been only one VIX. With the recent arrival of the India VIX, Oil VIX, Gold VIX, and Euro VIX, there is ample room for confusion about what exactly “VIX” means. On the other hand, “VIX” is really just shorthand for a generic “volatility index.” If this potential confusion can be overcome, the CBOE may have found a way to enhance and extend the most successful product and brand they have ever launched – and in the process dramatically change the volatility landscape.


DISCLAIMER: "VIX®" is a trademark of Chicago Board Options Exchange, Incorporated. Chicago Board Options Exchange, Incorporated is not affiliated with this website or this website's owner's or operators. CBOE assumes no responsibility for the accuracy or completeness or any other aspect of any content posted on this website by its operator or any third party. All content on this site is provided for informational and entertainment purposes only and is not intended as advice to buy or sell any securities. Stocks are difficult to trade; options are even harder. When it comes to VIX derivatives, don't fall into the trap of thinking that just because you can ride a horse, you can ride an alligator. Please do your own homework and accept full responsibility for any investment decisions you make. No content on this site can be used for commercial purposes without the prior written permission of the author. Copyright © 2007-2023 Bill Luby. All rights reserved.
 
Web Analytics