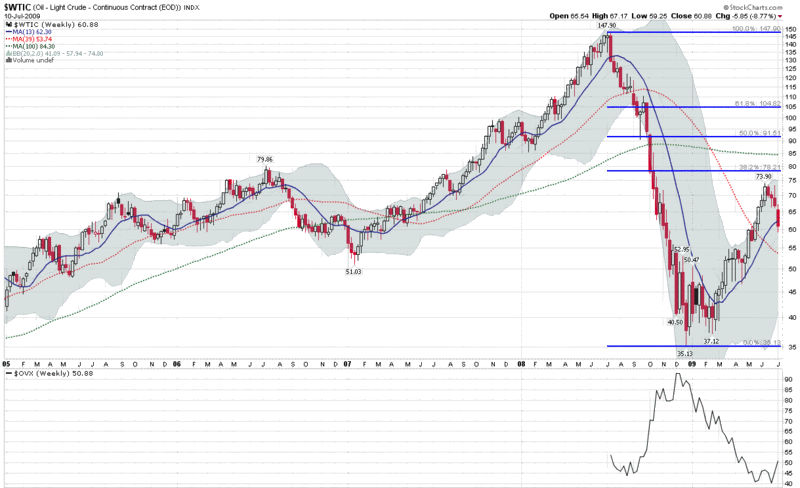
Chart of the Week: Crude Oil and Volatility
While stocks have gyrated wildly during the course of the past year, fluctuations in the price of crude oil have been even more dramatic. Crude oil hit a high of 147.90 one year ago yesterday, on July 11, 2008, yet fell 76.2% to reach a low of 35.13 just five months later.
The chart of the week, below, captures the weekly changes in the price of West Texas Intermediate crude oil since the beginning of 2005. Note that the 39 week moving average (solid red line), which encompasses three quarters, aligns very closely to the classic 200 day moving average that is frequently found in charts of daily bars. Crude oil made a bottom 29 weeks ago and as a result, the 39 week (and 200 day) moving average should begin to rise during the course of the next 2-3 weeks, providing technical support for this commodity.
Note also that the Oil VIX (OVX), which was launched one year ago this coming Wednesday reflects the volatility in crude oil prices during this period. While the VIX never reached 90 during the market turmoil, the OVX hit 103.54 in November and currently sits at 50.88, some 75% higher than the VIX.

[source: StockCharts]


0 comments:
Post a Comment