Chart of the Week: Volatility and Mean Reversion in 1987-88 and 2008-09
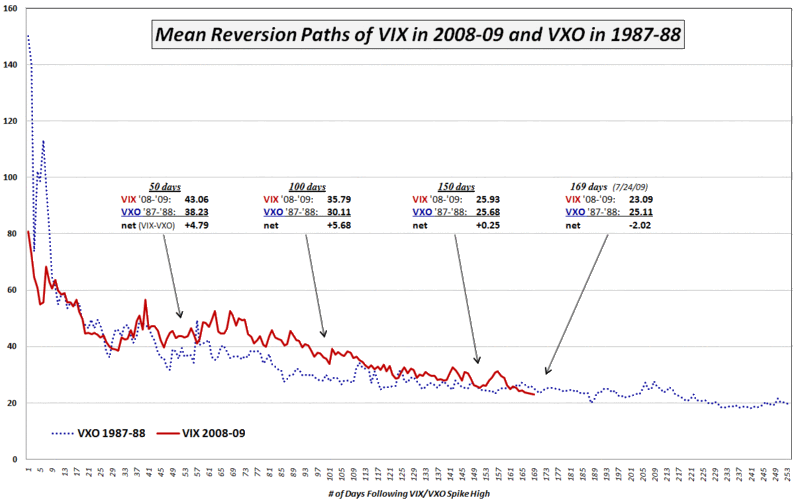
In this week’s chart of the week, I have elected to compare the aftermath of volatility spikes in 1987 and 2008. For the 1987 series, which begins with Black Monday, I have chosen to use a reconstruction of the ‘original VIX’ which has been tracked under the VXO ticker since 2003 and peaked at approximately 172; for 2008 I begin on November 20th, which the close of 80.86 is the highest VIX close ever.
The key takeaway is that for the first six months after the volatility spike high, post-spike volatility fell faster in 1987-88 than it did in 2008-09. This is not surprising in that the consensus of opinion is that there was much less structural volatility and a much shorter period of extreme risk during 1987-1988 than in 2008-09. Interestingly enough, however, now that we are eight months and 169 trading days removed the November 20th VIX spike, it turns out that volatility has fallen to much lower levels in the current environment than in the eight months following the 1987-88 volatility spike.
The graphic highlights that volatility remained at a higher level in 2008-09 than 1987-88 throughout the 50, 100 and 150 day milestone. In the last month, however, the absolute level of volatility for 2009 has been consistently lower than the readings from 21 years ago. Whether there is indeed less risk in 2009 than 1988 or whether the current period is simply characterized by higher levels of complacency remains to be seen.
For those who may want to chime in about comparing the VIX to the VXO, please note that the VIX closed at 23.09 on Friday and the VXO closed at 23.06. Using VXO data for 2008-2009 would result in the same takeaways and only slightly different data.
For a related post, see:

[source: Yahoo]


1 comments:
I wonder, if it makes sense to compare to previous bubbles. The prior bubble bottomed in march 03 (similar to our recent bottom). At the end of July 03, the VIX was trading at around 22, while the VXO was around 24.
What is interesting to note however is the VIX continued to decline into the teens for the rest of that year. In fact, over the next few years, the market staged a massive rally with the VIX entering a multi-year down trend, almost reaching single digits at one point.
So while there are many out there that will point to the current VIX level as an arguement of why a top may be near (and they may be right), i think we should be open to the possiblity that it could head significantly lower.
Post a Comment