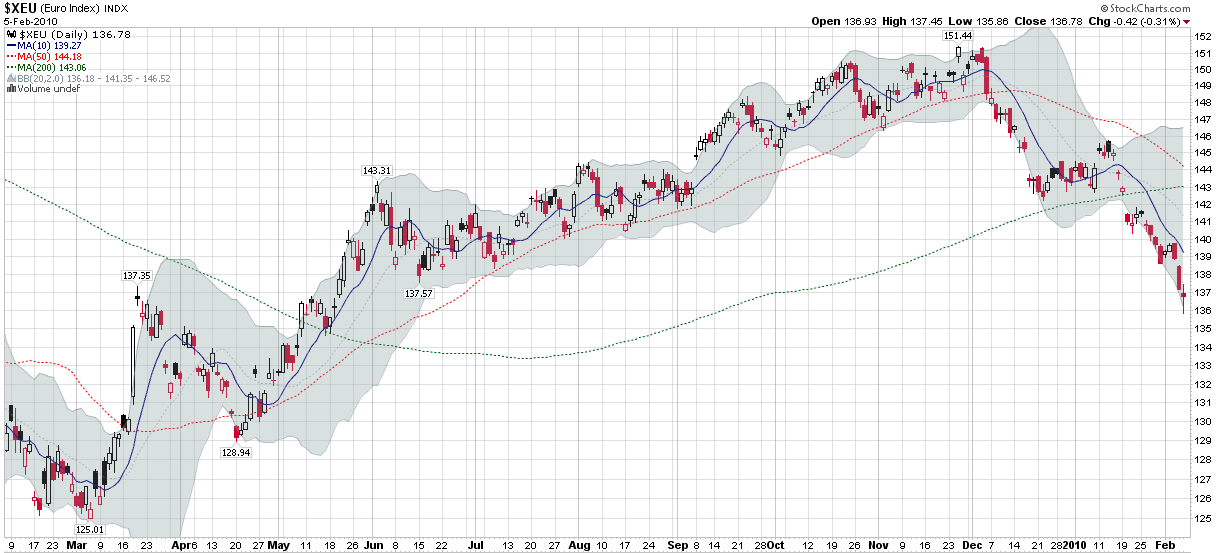
Chart of the Week: Where and When Will the Euro Bottom?
Last week was the type of trading week that raised a lot more questions than it answered – at least for me.
The epicenter of many of those questions seems to be southern Europe, where Greece, Portugal, Spain and to a lesser extent the remainder of the so-called PIIGS (Portugal, Italy, Ireland, Greece and Spain) have flamed investor concerns that burgeoning public debt may significantly weaken investor demand for sovereign debt and exacerbate an already trouble budgetary crisis.
Many investors have taken to selling the euro is as a means by which to reduce exposure to these problem areas and/or speculate on one or more of these crises spiraling out of control. This week’s chart of the week looks at one year of the euro, including a strong rally through most of 2009 and more recently and two-stage selloff, starting in the first half of December and picking up steam over the course of the past 3 ½ weeks as traders looked to capitalize on weakness stemming from the problems in Greece, Portugal and Spain.
Going forward, that ability of the euro to hold support at 136 will be one of the market tells that I watch closely.
For related posts on these subjects, readers are encouraged to check out:
- Greece, Spain and the Pulse of European Anxiety
- The Credit Default Swap Canary
- Chart of the Week: Dollar Rising?

[source: StockCharts]
Disclosures: none

