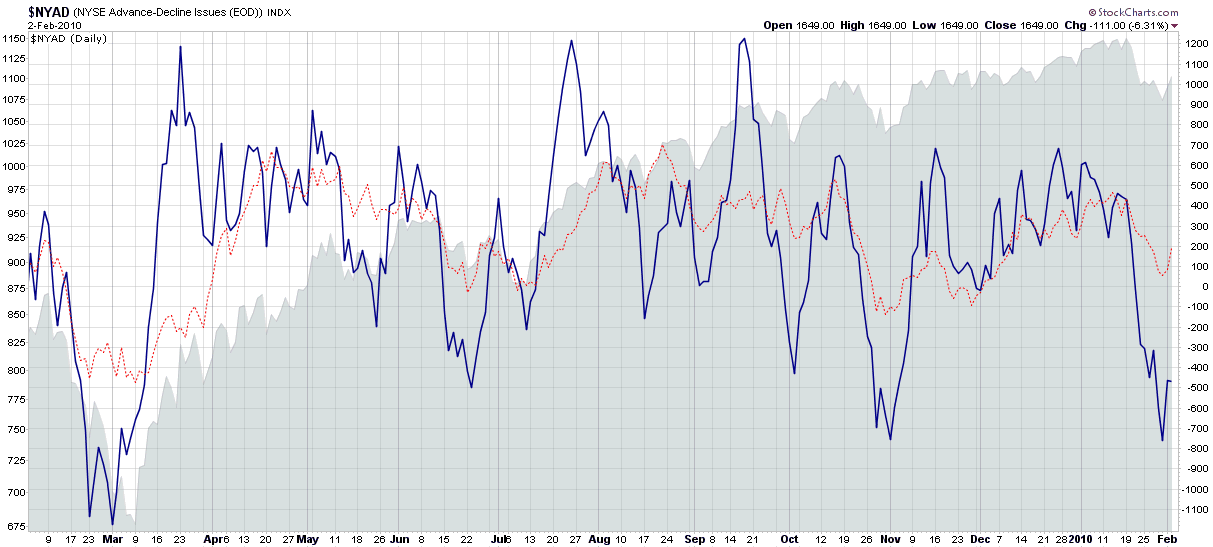
Mamis Overbought-Oversold Indicator
One of the books I have recommended frequently to beginning investors is When to Sell, which was written by Justin Mamis in 1977. Among the books many gems Mamis unveils is the Overbought-Oversold Indicator, which is a simple 10 day moving average of the NYSE advances minus declines. Helene Meisler, a Mamis protégé, later popularized the Overbought-Oversold Indicator and blogger Ron Sen at Technically Speaking has championed the same indicator over the past few years, usually adding in a 30 day moving average for comparison purposes and calling it the Mamis-Meisler Breadth Oscillator.
In non-trending markets, a good market breadth oscillator can be a trader’s best friend and with the SPX for now at least apparently stuck in a trading range between 1070 and 1150, breadth becomes an important piece of the overall technical puzzle.
The chart below captures what I will call the Mamis Overbought-Oversold Indicator (MOOI?) and shows negative extremes in the 10 day moving average (solid blue line) of at least -400 to be solid predictors of oversold conditions. The positive extremes (dotted red line) of +700 or so are less valuable in terms of calling market tops, but often presage a selloff. Right now, the indicator suggests a bullish oversold market.
Of course there are no perfect technical indicators, but in choppy markets a reliable market breadth oscillator can be a powerful timing tool.
For more on related subjects, readers are encouraged to check out:
- The 52 Week Lookback Period and New Highs – New Lows
- Relative Highs and Lows in the SPX
- The McClellan Summation Index

[source: StockCharts]
Disclosures: none

