Nonfarm Payrolls Before and After Recessions
I was pleased to see that Sunday’s Chart of the Week: A Broader Look at the U.S. Recovery generated a good deal of interest and discussion. While I have always been a card carrying Quadropheniac, truth be told the only slice of the economy anyone is obsessing about these days is jobs. So with the weekly jobless claims numbers due out tomorrow and the February nonfarm payrolls slated for a week from Friday, this seems like an opportune time to revisit the employment situation.
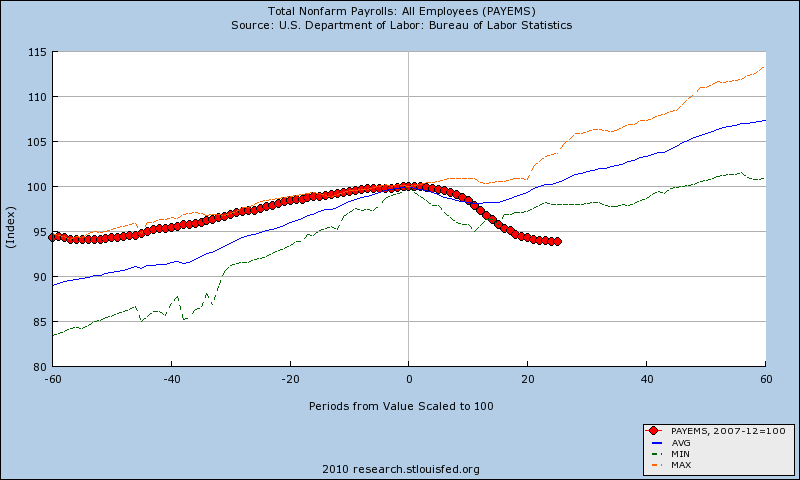
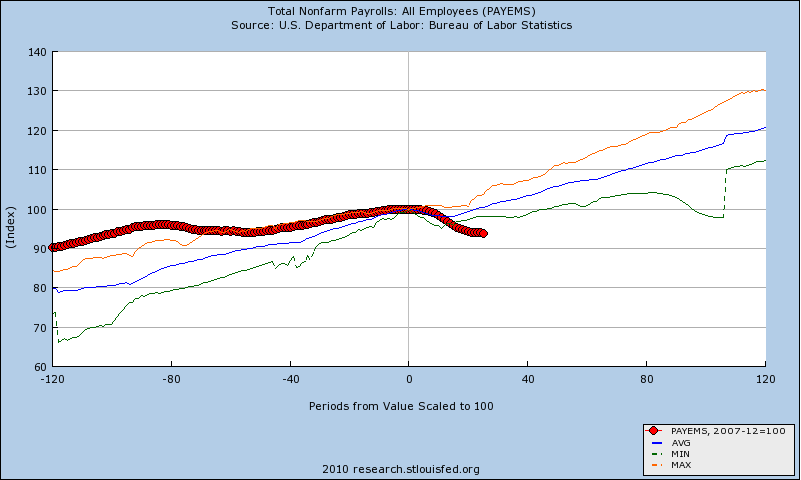
Since last Sunday’s chart measured nonfarm payrolls from 12 months prior to 27 months following the preceding business cycle peak, I have elected to take a much longer view of employment and recessions. The two charts below show employment trend data for five (top) and ten (bottom) years before and after each business cycle since 1948.
Note that in the years leading up to the December 2007 business cycle peak, job growth was relatively flat compared to the historical mean (blue line). More importantly, the performance during the current ‘recovery’ is not only anemic compared to prior post-recession job creation efforts, there is still no concrete evidence of a bottom in employment. The current economic environment is in stark contrast to prior recessions, where there economy has typically replaced all the jobs lost in the downturn at this stage and was already in a net positive job situation relative to the prior business cycle peak.
While I still anticipate that job growth will begin in the next few months, the longer this jobless recovery persists, the harder it will be to get the economy firing on all cylinders.
For more on related subjects, readers are encouraged to check out:
- Chart of the Week: Nonfarm Payrolls, Unemployment Rates and Time
- Chart of the Week: A Broader Look at the U.S. Recovery
- Chart of the Week: Four Key Economic Indicators
- Chart of the Week: Retail Sales Recovering


[source: Federal Reserve Bank of St. Louis]
Disclosures: none

