Showing posts with label FXE. Show all posts

Wednesday, October 31, 2012

EuroCurrency Volatility Index (EVZ) at Lowest Level Since March 2008, Diverges from VIX

Since its launch in August 2008, the CBOE EuroCurrency Volatility Index (ticker EVZ, sometimes known simply as the “euro VIX”), which is based on the FXE ETF, has toiled in relative obscurity compared to some of the more famous volatility indices.

Given all the fears about the European sovereign debt crisis over the past few years, I find the lack of interest in EVZ to be surprising. After all, in thinking about the euro zone one of the most basic questions has been whether or not the euro will survive.  Further, outside of the U.S. at least, the future of the euro zone is still considered to be the biggest risk to the stock market.

With all this in mind, I was looking at EVZ data this evening and discovered that today marks five years since the beginning of the historical EVZ data provided by the CBOE (reconstructed data fills the gap from November 2007 to the August 2008 launch.)

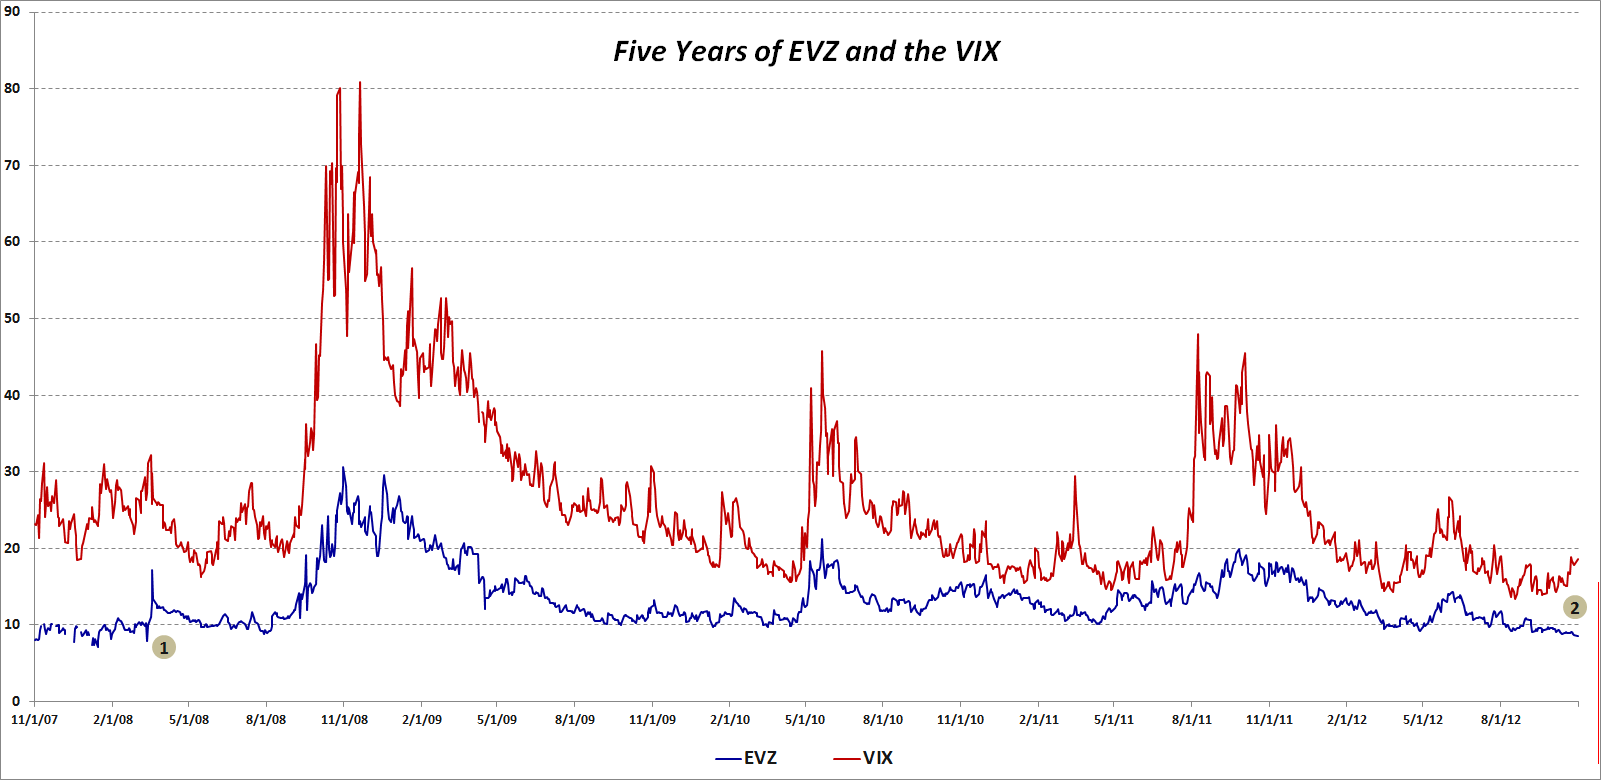
The chart below shows the history of closes in EVZ (blue line), as well as comparative closing prices for the VIX (red line.) I have annotated the chart to highlight two pieces of information:

  1. The last time that EVZ closed lower that it did today (8.55) was in March 2008, just before Bear Stearns collapsed and was sold to JP Morgan (JPM)
  2. The recent divergence between a falling EVZ and a rising VIX, which dates from the middle of September, is unusual, particularly given the length of the divergence

So…is EVZ understating the risk to the euro or is the VIX overstating the risk to stocks? Is it possible that these two measures of risk can be moving in opposite directions and both be right?

Related posts:

[source(s): CBOE]

Disclosure(s): none

Wednesday, June 27, 2012

Euro Volatility and Risk

With the euro zone summit looming, investors are scrambling to find all sorts of measuring sticks to evaluate the risks of a sharp move in the financial markets. Based on some of the emails I have received, many are skeptical of the VIX right now, which is trading in the mid 19s, some 5% below its lifetime mean. At 27.54, the VSTOXX (EURO STOXX 50 Volatility Index) is showing much more uncertainty, but even that number is low relative to the range of the VSTOXX for the past three months.

Whether Spain, Italy or Greece is the fixation du jour, the questions investors really want answers to ultimately all cluster around the future of the euro. I have addressed this question relative to the risk of one or more countries leaving the euro in the context of various Intrade contracts (see links below), but another overlooked manner of measuring risk and uncertainty in the euro is the CBOE EuroCurrency Volatility Index (EVZ). Sometimes referred to as the “euro VIX,” EVZ uses the VIX methodology to measure the market’s expectations of future volatility in the euro. In theory, therefore, EVZ should also be a proxy for risk and uncertainty in the euro. One might even go as far as to consider EVZ as a euro zone fear indicator.

So what is a chart of EVZ telling us on the eve of another euro zone summit?

The chart below shows that at 11.27, EVZ is currently in the lower portion of its range of 9.23 – 20.34 for the past year. Indeed EVZ is only in the 18th percentile of the range of values over the course of the past year. Also of interest, the current 20-day historical volatility of EVZ (60) is lower than the 180-day historical volatility measure (65) – as has been the case for the majority of the last six months. Last but not least, EVZ has been on a notable downtrend since June 18th.

Headlines aside, traders do not see a lot of currency risk in the euro right now, at least relative to the last year or so and as far as the 30-day forward-looking window defined by EVZ is concerned.

So if you think the VIX is depressed and understating market risk, don’t expect the EVZ to be signaling something different. Currency risk and uncertainty seem surprisingly low at current levels. If you think the market has underpriced the potential for a large move in the euro, then consider some long straddles on the euro or its ETF counterpart, FXE.

Related posts:

[source(s): LivevolPro.com]

Disclosure(s): Livevol is an advertiser on VIX and More

Sunday, March 28, 2010

Chart of the Week: Impact of Falling Euro on Stocks and Commodities

Given all the general economic problems facing Europe and the sovereign debt issues related to Greece and the PIIGS (Portugal, Italy, Ireland, Greece and Spain), it is not surprising that the euro has come under so much selling pressure as of late.

Considering that the dollar index is comprised of a weighted basket of foreign currencies of which the euro comprises 57.6%, it is not too much of a stretch to think of the dollar as an inverse euro – as their almost mirror image in the chart below suggests. So given that recent weakness in the euro is accounting for most of the dollar’s resurgence and the dollar has a strong influence on the prices of commodities and stocks, it is meaningful to consider how the fluctuations in the euro have translated into changes in stocks and commodities.

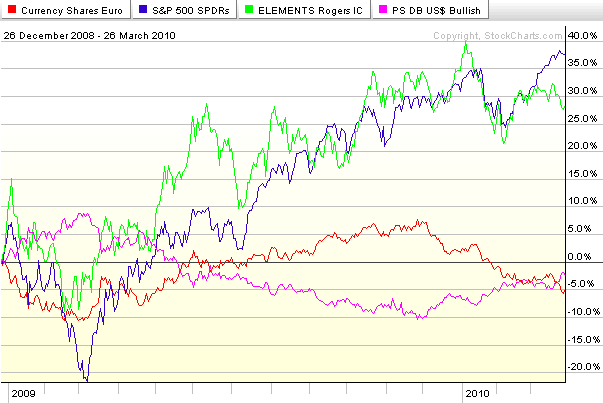
This week’s chart of the week looks at ETFs for the euro (FXE), dollar (UUP), stocks (SPY) and commodities (RJI) for the last 15 months. Following the bottom of the stock market in March 2009, the euro (red line) rallied in concert with the S&P 500 index (blue line) and commodities (green line) through December 2009. As the euro began to weaken, however, both stocks and commodities initially continued their bullish climb, before selling off in January and the beginning of February. Since the early February lows, stocks (SPY) have managed to rally in spite of a weakening euro and firming dollar (purple line). Commodities, which tend to react more strongly to currency fluctuations, have struggled much more with euro weakness and dollar strength. Should the euro continue to fall, it is reasonable to expect stocks to continue to outperform commodities and of course euro weakness to directly lift the dollar to new heights.

For more on related subjects, readers are encouraged to check out:


[source: StockCharts.com]

Disclosure(s): none

DISCLAIMER: "VIX®" is a trademark of Chicago Board Options Exchange, Incorporated. Chicago Board Options Exchange, Incorporated is not affiliated with this website or this website's owner's or operators. CBOE assumes no responsibility for the accuracy or completeness or any other aspect of any content posted on this website by its operator or any third party. All content on this site is provided for informational and entertainment purposes only and is not intended as advice to buy or sell any securities. Stocks are difficult to trade; options are even harder. When it comes to VIX derivatives, don't fall into the trap of thinking that just because you can ride a horse, you can ride an alligator. Please do your own homework and accept full responsibility for any investment decisions you make. No content on this site can be used for commercial purposes without the prior written permission of the author. Copyright © 2007-2023 Bill Luby. All rights reserved.
 
Web Analytics