Showing posts with label SPY. Show all posts

Sunday, March 28, 2010

Chart of the Week: Impact of Falling Euro on Stocks and Commodities

Given all the general economic problems facing Europe and the sovereign debt issues related to Greece and the PIIGS (Portugal, Italy, Ireland, Greece and Spain), it is not surprising that the euro has come under so much selling pressure as of late.

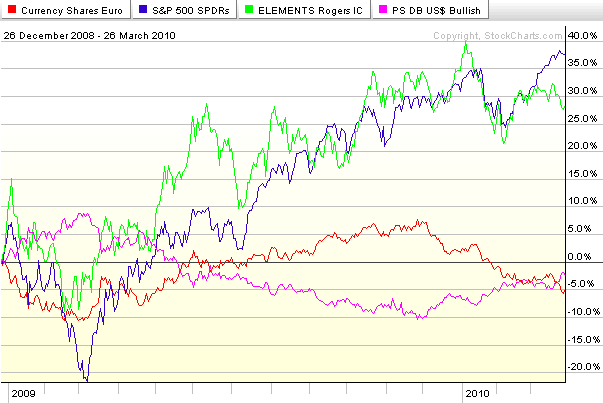
Considering that the dollar index is comprised of a weighted basket of foreign currencies of which the euro comprises 57.6%, it is not too much of a stretch to think of the dollar as an inverse euro – as their almost mirror image in the chart below suggests. So given that recent weakness in the euro is accounting for most of the dollar’s resurgence and the dollar has a strong influence on the prices of commodities and stocks, it is meaningful to consider how the fluctuations in the euro have translated into changes in stocks and commodities.

This week’s chart of the week looks at ETFs for the euro (FXE), dollar (UUP), stocks (SPY) and commodities (RJI) for the last 15 months. Following the bottom of the stock market in March 2009, the euro (red line) rallied in concert with the S&P 500 index (blue line) and commodities (green line) through December 2009. As the euro began to weaken, however, both stocks and commodities initially continued their bullish climb, before selling off in January and the beginning of February. Since the early February lows, stocks (SPY) have managed to rally in spite of a weakening euro and firming dollar (purple line). Commodities, which tend to react more strongly to currency fluctuations, have struggled much more with euro weakness and dollar strength. Should the euro continue to fall, it is reasonable to expect stocks to continue to outperform commodities and of course euro weakness to directly lift the dollar to new heights.

For more on related subjects, readers are encouraged to check out:


[source: StockCharts.com]

Disclosure(s): none

Wednesday, November 12, 2008

People Trading BIDU Also Traded…

Back in September 2007, I started periodically posting snapshots from the optionsXpress Trading Patterns feature and chose to highlight the highly speculative Chinese internet search firm, Baidu (BIDU), then trading at 299, as my guinea pig. Over the course of seven months, I twice updated what traders who traded BIDU were also trading at optionsXpress when BIDU was at 380 on 10/30/2007 and when it was at 350 on 4/22/2008.

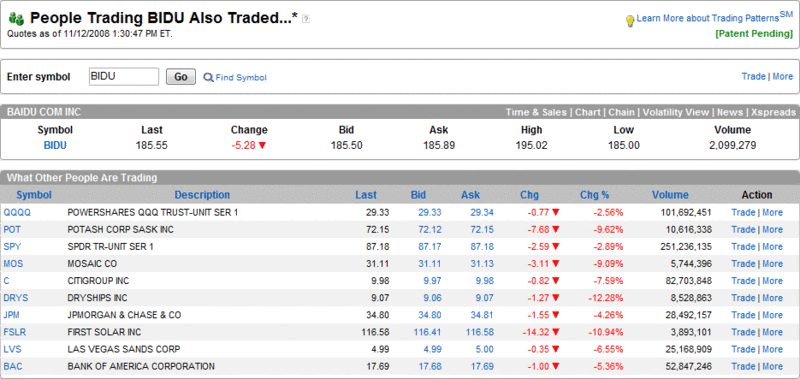
I just captured the most recent Trading Patterns update, which shows traders who are trading BIDU (currently at 185) are still active in the most volatile names in agriculture, financials, shipping, solar, and casinos. The stocks on the top ten list: Potash (POT), Mosaic (MOS), Citigroup (C), JPMorgan Chase (JPM), Bank of America (BAC), DryShips (DRYS), First Solar (FSLR), and Las Vegas Sands (LVS). Also on the list are two ETFs, QQQQ and SPY. Either optionsXpress customers have been cleaning up on the short side or they are a little early to the bull party.

[source: optionsXpress]

Tuesday, June 24, 2008

SPY Put Volume Study

For those who were underwhelmed by yesterday’s monthly charts of the call volume and put to call ratios for the VIX, I am going to try to whelm you a little more by switching over to weekly charts of SPY (the ETF for the S&P 500 index) puts.

The logic here is that those who may not want to be short the market (or hedge long positions) with the additional leverage of VIX calls may prefer the increased liquidity, dollar strike price increments, and penny pricing benefits of SPY puts.

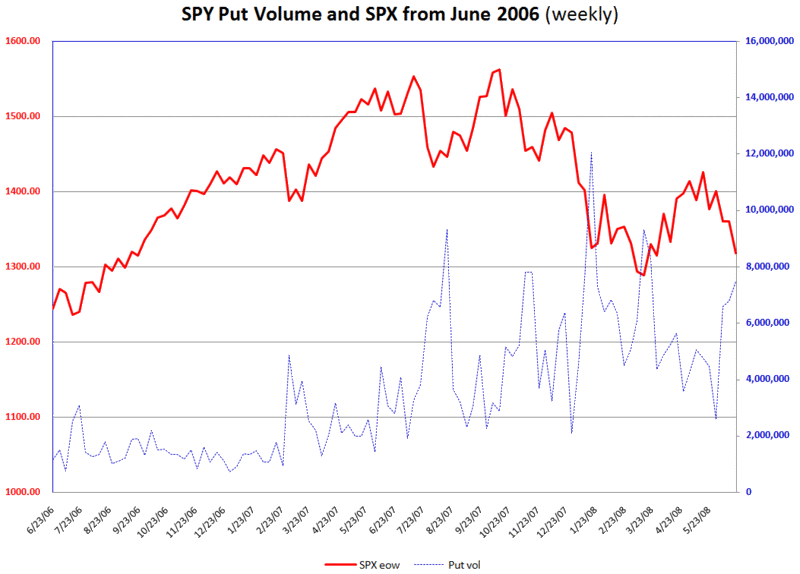
Looking at the chart below, the SPY put volume correlates nicely with intermediate bottoms in the SPX/SPY. Note the current spike in put volume. It is something to think about, anyway, as you contemplate what the Fed could possibly say that might put a stop to the slide in the equities market.

Monday, July 30, 2007

RUT Hedge Fund Puke?

On the off chance that there are readers out there who have not bothered to read Bernie Schaeffer’s market commentary because it requires a free registration to Schaeffer’s Research, you really should rethink that idea. Take, for instance, Schaffer’s “Monday Morning Outlook: Fear Swells Amid Market Pullback,” which was published earlier this morning. Here Schaeffer pulls a gem from Stonebrook Structured Products, a provider of hedge fund replication strategies:

“A large part of hedge fund returns are driven by shorting large-cap growth and the going long small-cap value and emerging market equity. True alpha accounts for only 20-25% of industry returns.”

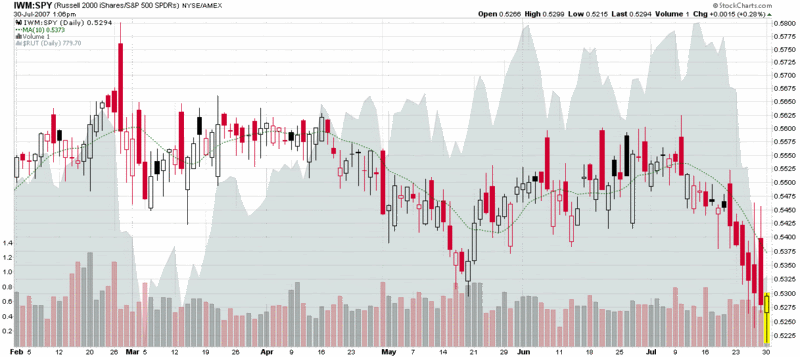
Schaeffer extends this idea to come up with a hypothesis for the recent substantial performance gap for small caps (as evidenced by the Russell 2000 falling almost three times as hard as the large cap indices):

“Once the more volatile smaller-cap stocks began to seriously under perform the S&P, their short S&P hedges were not sufficiently protecting them (which caused them to be ‘too long’ in a market correction) and the hedge funds then needed to go out and sell stock from their portfolios and/or short the IWM or buy IWM puts. And all of this served to further blast the IWM.”

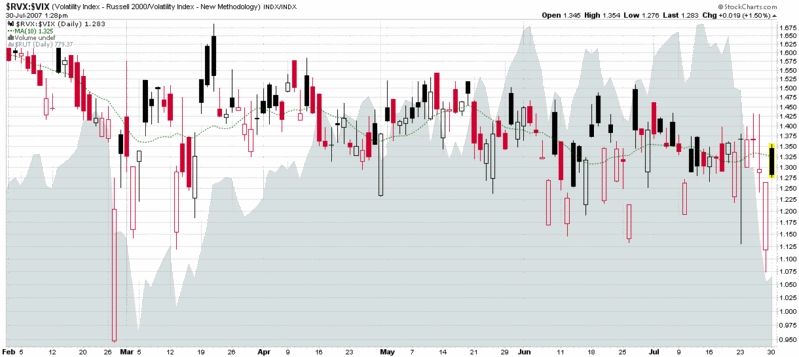
Interestingly, a look at the volatility of the Russell 2000 index (RVX) compared to the VIX does not reveal the underlying dynamic that Schaeffer suggested, but a study of the ratio of the IWM to the SPY does support his contention. See the two charts below for a better sense of this.

One key takeaway from this exercise is that some important volatility-related information is flying under the radar of the volatility indices. Another key takeaway is that ETFs are not only the driving the force in the markets these days, but they need to be a central part of any market technician’s analytical toolbox as well.


Tuesday, July 3, 2007

Using the VIX as a Timing Tool for the SPY

Since I am still playing a little bit of catch-up today, I am going to piggy-back on some third party content for today’s post. Specifically, I want to introduce some ideas from MarketSci.com on how to use the VIX to trade the SPY. In a three part series which I have linked below, MarketSci lays out three systems which use the VIX to time SPY trades. These include a long-term system using a 186 day VIX SMA which Barron’s cited in December 2006 as being developed by Credit-Suisse; an 11 day EMA-SMA VIX crossover system; and an 11 day EMA-SMA system which utilizes both the VIX and the SPY as triggers:

Part 1: Long-term Trading with the VIX – 20% deviations from the 186 day VIX SMA

Part 2: Short-term Trading with the VIX – an 11 day EMA-SMA VIX crossover system

Part 3: Our Spin on Trading with the VIX – a combined 11 day EMA-SMA VIX and SPY system

In many respects, these approaches are the SPY complement to the VIX mean reversion plays that I blog about on a regular basis in this space. Of course, unlike the VIX, trading the SPY has the benefit of being able to go long or short the ETF, use 2x leverage long with the SSO or short with the SDS, and use options on the underlying.

So far I have shied away from discussing the VIX as a market timing tool, but as I have increasingly become convinced of its applicability in this area, expect to hear more from me on this in the future.

Monday, May 14, 2007

IV and HV for SPY and VIX

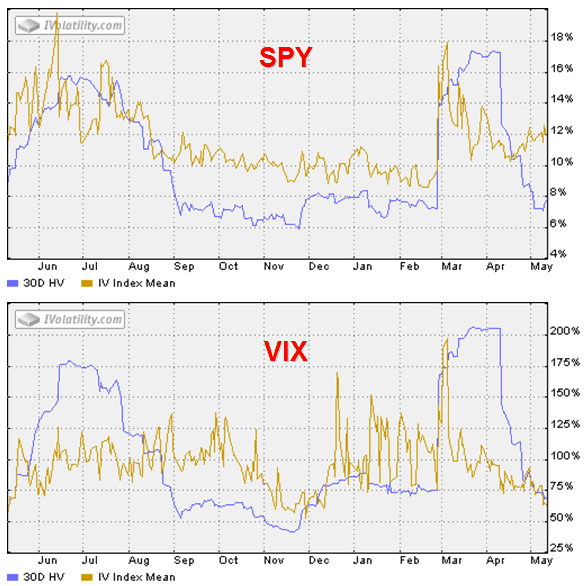
Earlier today, Adam at Daily Options Report posted a one year chart of the implied and historical volatility for SPY (commonly known as SPDRs or Spiders, the original ETF used to track the S&P 500 index) to help drive home the point that for all but one of the past eight and a half months, the SPY options have been overpriced relative to the volatility of the underlying. Adam’s bottom line is that the gap between the current IV and historical IV for SPY is at least as wide as it has been during the past year.

Since I have not done so before, I thought it might be instructive to juxtapose (my favorite word, but I digress…) the identical VIX chart to see if any related conclusions might jump off of the page.

In looking at the charts below, at least four different conclusions immediately present themselves to my eye:

  • unlike SPY, the VIX IV has, on average, tracked reasonably close to historical volatility over the course of the past year; with the exception of brief spikes, only in June-July and September-October (in the pre-2/27 world) were there significant enduring discrepancies

  • the current VIX IV and HV are almost identical, in sharp contrast to the wide spread in the SPDRs

  • since mid-April the SPY IV has risen noticeably, while the VIX IV has continued to drop

  • partly as a consequence of the above, while the SPY IV is close to the middle of its one year range, the VIX IV is at the bottom of the range, approaching a one year low

I am not sure what to make of these discrepancies at the moment, but I thought I would pass along my observations and invite reader contemplation and comment. In thinking about the VIX vs. the SPY, keep in mind that VIX options are based off of futures and consequently have a slightly different time horizon than SPY options.

Monday, March 5, 2007

Long Volatility with the Exchanges

In the rush to capitalize on the sudden volatility in the markets, many have jumped in to buy VIX calls not fully realizing what they were getting in to. Adam Warner summarizes Barron’s take on some of the shortcomings of VIX options as an investment vehicle and reiterates his own perspective, which is essentially that the more sensible and direct play is SPY options. For the record, I am in agreement here and have stated some other reasons why VIX options may not be appropriate for all by the most experienced options traders.

Here is another way to play volatility without even resorting to options or ETFs: the exchanges. CME just reported record options volume in February and will likely continue to be a beneficiary as concerns about increased risk and volatility create new demand for derivatives to reduce risk and volatility going forward. This morning, CME is down more than 50 points from the January high of 596.

Another options exchange play is ISE. This smaller electronic options exchange had a strong February, but has more question marks than its larger rivals. ISE is down about 12% since February 23rd and may be an attractive takeover target.

DISCLAIMER: "VIX®" is a trademark of Chicago Board Options Exchange, Incorporated. Chicago Board Options Exchange, Incorporated is not affiliated with this website or this website's owner's or operators. CBOE assumes no responsibility for the accuracy or completeness or any other aspect of any content posted on this website by its operator or any third party. All content on this site is provided for informational and entertainment purposes only and is not intended as advice to buy or sell any securities. Stocks are difficult to trade; options are even harder. When it comes to VIX derivatives, don't fall into the trap of thinking that just because you can ride a horse, you can ride an alligator. Please do your own homework and accept full responsibility for any investment decisions you make. No content on this site can be used for commercial purposes without the prior written permission of the author. Copyright © 2007-2023 Bill Luby. All rights reserved.
 
Web Analytics