Showing posts with label SDS. Show all posts

Wednesday, July 8, 2009

Options Available for New S&P 500 Triple ETFs

Though they are less than two weeks old, the two new triple ETFs based on the S&P 500 index already have options available to trade. The bullish 3x ETF, Ultra ProShares (UPRO) has July options that expire one week from Friday with strikes from 60 to 95, including single dollar increments from 80 through 90. The bearish -3x Short ProShares (SPXU) has options available from 70 to 95, with all the strikes in single dollar increments.

In anticipation of a broad range of applications and the potential for some significant movement, the strikes for the December options range all the way from 30 to 140 for UPRO and from 40 to 150 for SPXU.

While both of these triple ETFs have been attracting more volume each day, neither has managed to break the million share mark yet. I anticipate that we will begin to see million share days in each of these ETFs next week and shortly thereafter, UPRO and SPXU will begin to trade in the volumes currently associated with leveraged ETF pairs such as FAS/FAZ and SSO/SDS.

As these triple ETFs are based on the same underlying as the VIX, an entire new genus of trading strategies is being hatched as I write this…

Wednesday, September 10, 2008

VXN:QID Ratio Reflects Unusual Complacency

With the Fannie/Freddie bailout getting no better than mixed reviews, the U.K., Germany, and Spain apparently headed for a recession, and continuing turmoil in emerging markets, sometimes I am surprised to see any green at all on my screen.

On the other hand, I’m sure some are wondering how close we can be to a collapse in the world’s financial system if the VIX is trading in the 24s.

It’s a valid question – and one I have addressed in the past on the blog with the benefit of several indicators which help evaluate how much complacency is in the market. One of these is a ‘fearogram,’ which measures the ratio of changes in the VIX to changes in the SPX. A similar tool is the VIX:SDS ratio, which compares the relative movements of the VIX and SDS (the double inverse ETF for the SPX) to historical patterns.

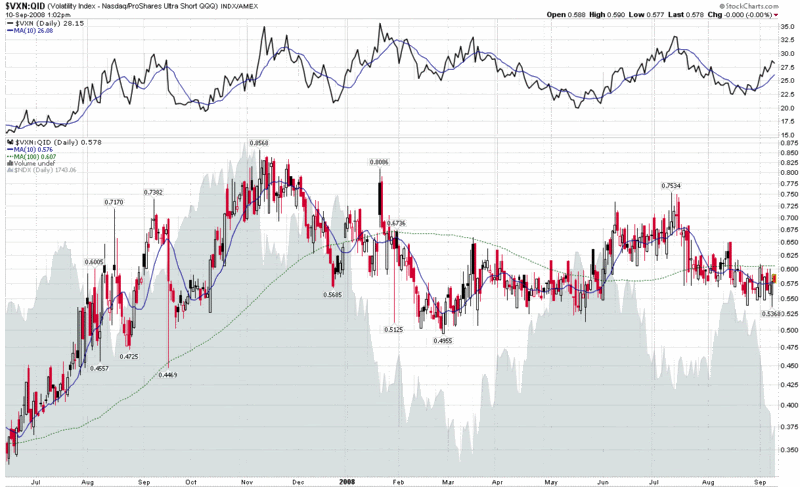
Below I have created a chart of the VXN:QID ratio, a sister to the VIX:SDS ratio. This chart compares volatility in the NASDAQ-100 index (NDX) to the double inverse ETF for the NDX. There are (at least) three ways to think about complacency in this chart:

  1. the absolute level of the ratio
  2. the level of the ratio relative to the 10 day simple moving average
  3. the level of the ratio relative to the 100 day simple moving average

Looking at the chart, consider that lower readings generally correspond to lower levels of complacency (i.e., less volatility and fear per unit of decline). The current ratio is moderately low on an absolute scale, but is lodged neatly between the 10 and 100 day SMAs. What I find particularly interesting about the chart is that in those instances in which the VXN has experienced a sustained rise over a period of several weeks or more (see top section of graphic), the current situation is the first time the ratio has not risen on par with the VXN. This development is a divergence worth watching and one which appears to favor the bears.

[source: StockCharts, VIX and More]

Thanks to all who responded to my call for help about creating blog posts in Word and publishing them to Blogger. For the record, this is my first post using Windows Live Writer, which has been up to the task so far...

Friday, August 8, 2008

Increasing Options Volume in Double Inverse ETFs Crowding Out VIX Options?

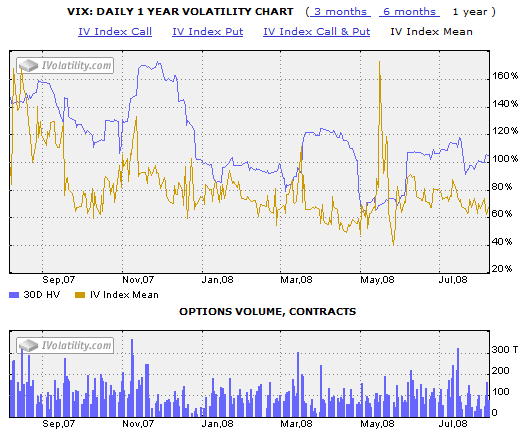
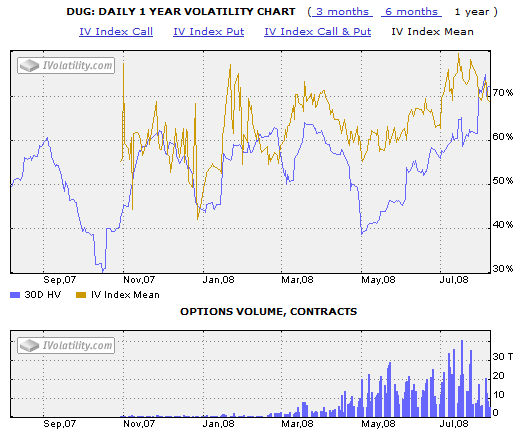
One year ago this month, VIX options peaked in popularity. As the graphic below from IVolatility.com shows, VIX options continue to trade at impressive volumes of about 100,000 contracts per day, but this number is about 30% below the levels from August-November of last year.


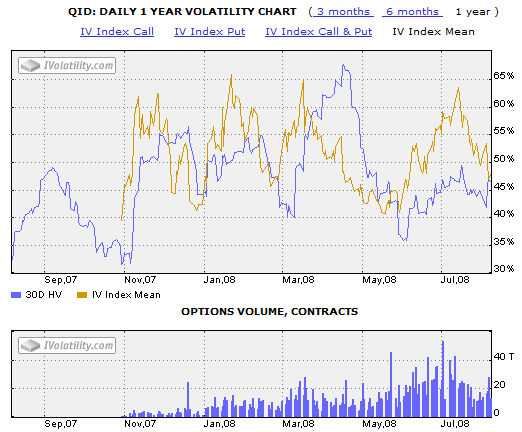
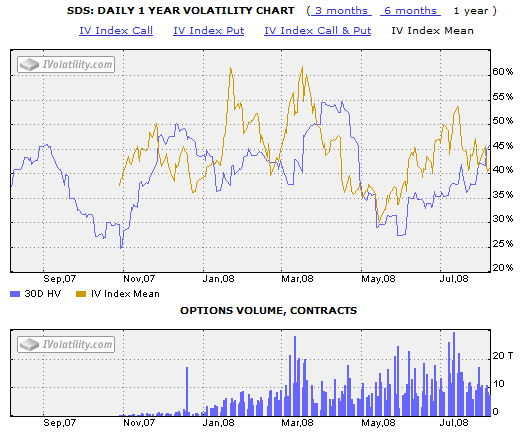
Part of the reason for this change in trading patterns is that some of the portfolio hedging trades formerly conducted with VIX options are now being redirected to options on double inverse ETFs. Back in February, in Interest in VIX Waning? I spoke about how the new trend seemed to favor QID options over VIX options. Six months later, the popularity of QID and SDS options persists, with QID + SDS options now accounting for approximately one third of the volume in VIX options.


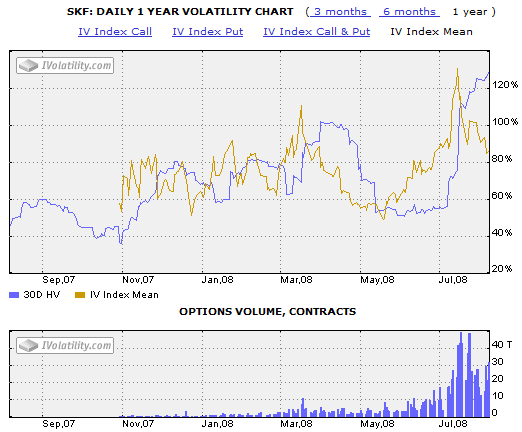
More recently, the rise of double inverse sector ETF options has translated into more choices for investors and lower market share for the VIX. While sector options are more likely than VIX options to be used for speculative purposes than as portfolio hedges, the surge in options volume for double inverse sector ETFs is worth highlighting here, with the SKF (double inverse sector ETF for financials) and DUG (double inverse sector ETF for oil and gas) receiving the most interest.

The rise of inverse and double inverse ETFs raises a number of questions about the VIX and poses some challenges for the index as a portfolio hedging tool and as a sentiment indicator. I will delve into these two subjects in more detail in the coming weeks and months.


Monday, September 24, 2007

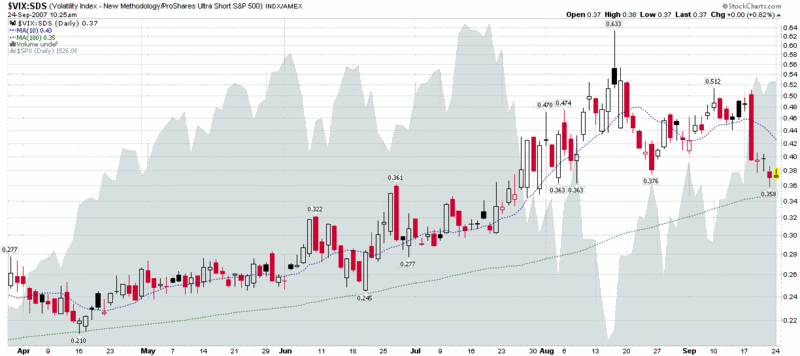
VIX:SDS Ratio a Keeper?

I’ll be the first to admit that I keep track of a boatload of silly VIX charts (hey, it’s better than a house full of cats…) that no person in their right mind should ever bother with, but every now and then one speaks to me in a convincingly enough fashion that I keep going back to it.

So here I am with the VIX:SDS ratio chart again. Alan Greenspan says that the holy grail of market forecasting is a fear vs. euphoria indicator. Frankly, this one is good enough for me – at least for the moment. Given that the SDS ETF has only been around since July 2006, there is little in the way of historical information with which to do some backtesting, but I like how the VIX:SDS ratio has been acting during the recent market action. The ratio may not be a perfect way to decompose the fear and volatility components of the VIX, but it certainly offers a fair share of clues. One way to look at the current reading, for instance, would be to interpret only a small fear premium built into the ratio vis-à-vis the more ‘normal’ sentiment expressed by the 100 day SMA.

If anyone has thoughts on this indicator – pro or con – feel free to use the comments section below to make your opinion heard.

Monday, August 27, 2007

Another Look at the VIX:SDS Ratio

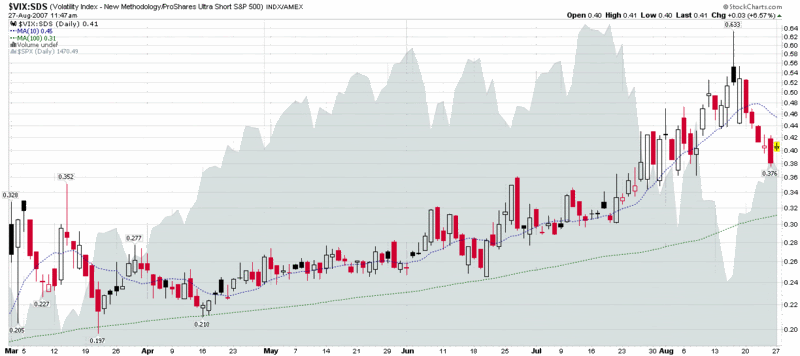
Back on August 10th, when the markets were testing the first set of lows, I toyed with several indicators that I thought might help me better separate fear from volatility. I published a 10-day chart of one of those, the VIX:SDS ratio.

I have been keeping an eye on this ratio during the past 2 ½ weeks and noticed that the extreme reading of .633 it did an excellent job of flagging the recent market bottom. I am still not sure how useful the VIX:SDS ratio may be going forward, but I thought a six month chart might be interesting analytical fodder for those who like to contemplate such matters. As always, comments are welcome.

As a quick reminder, SDS is an ETF that is intended to track at 2x the inverse of the SPX. More information is available from ProShares.

Friday, August 10, 2007

Fear vs. Volatility

Astute observers may have noticed several instances over the past few days where VIX tops and market bottoms have parted company. Part of the reason for this is that the fear component of the VIX has recently grown large enough that it has sometimes overshadowed the volatility component. We have a lot of volatility at the moment, but we have more fear than we have seen in a very long time.

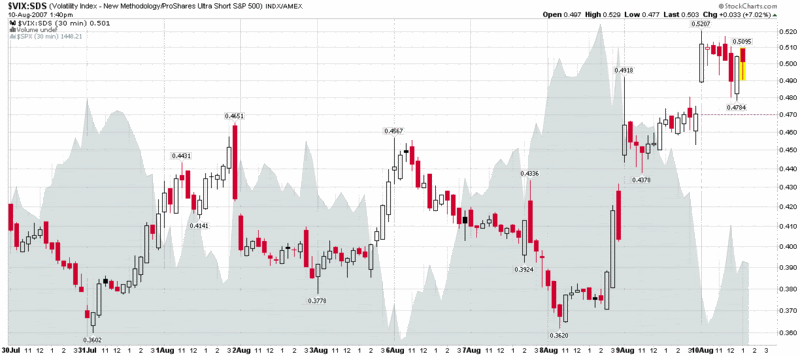
It is difficult to decompose fear and volatility by looking at charts, but one worth examining is the ratio of the VIX to the SDS, which is the 2x inverse ETF of the SPX. The graphic below is a 10 day chart with 30 minute bars, with the SPX behind it in gray. It shows the type of mirror image you would expect between volatility and market movements up until the latter stages of Wednesday’s session. From that point on, the formerly predictable negative correlation becomes significantly muddier, to the point where today’s session shows the ratio way out of proportion to the market downdrafts.

Some of this decoupling is clearly traders buying puts to protect themselves against Monday’s headline risk, but I do not believe this is the entire story. As the markets have rallied during the course of the day, the VIX to SDS ratio has remained stubbornly higher, suggesting that the fear component of the VIX may now be the tail wagging the volatility dog. I will see if I can do a better job of coming up with graphical data to support my contention, but you can now see and feel the fear in the markets, even if it is not that easy to isolate it in the charts.

Tuesday, July 3, 2007

Using the VIX as a Timing Tool for the SPY

Since I am still playing a little bit of catch-up today, I am going to piggy-back on some third party content for today’s post. Specifically, I want to introduce some ideas from MarketSci.com on how to use the VIX to trade the SPY. In a three part series which I have linked below, MarketSci lays out three systems which use the VIX to time SPY trades. These include a long-term system using a 186 day VIX SMA which Barron’s cited in December 2006 as being developed by Credit-Suisse; an 11 day EMA-SMA VIX crossover system; and an 11 day EMA-SMA system which utilizes both the VIX and the SPY as triggers:

Part 1: Long-term Trading with the VIX – 20% deviations from the 186 day VIX SMA

Part 2: Short-term Trading with the VIX – an 11 day EMA-SMA VIX crossover system

Part 3: Our Spin on Trading with the VIX – a combined 11 day EMA-SMA VIX and SPY system

In many respects, these approaches are the SPY complement to the VIX mean reversion plays that I blog about on a regular basis in this space. Of course, unlike the VIX, trading the SPY has the benefit of being able to go long or short the ETF, use 2x leverage long with the SSO or short with the SDS, and use options on the underlying.

So far I have shied away from discussing the VIX as a market timing tool, but as I have increasingly become convinced of its applicability in this area, expect to hear more from me on this in the future.

DISCLAIMER: "VIX®" is a trademark of Chicago Board Options Exchange, Incorporated. Chicago Board Options Exchange, Incorporated is not affiliated with this website or this website's owner's or operators. CBOE assumes no responsibility for the accuracy or completeness or any other aspect of any content posted on this website by its operator or any third party. All content on this site is provided for informational and entertainment purposes only and is not intended as advice to buy or sell any securities. Stocks are difficult to trade; options are even harder. When it comes to VIX derivatives, don't fall into the trap of thinking that just because you can ride a horse, you can ride an alligator. Please do your own homework and accept full responsibility for any investment decisions you make. No content on this site can be used for commercial purposes without the prior written permission of the author. Copyright © 2007-2023 Bill Luby. All rights reserved.
 
Web Analytics