VXN:QID Ratio Reflects Unusual Complacency
With the Fannie/Freddie bailout getting no better than mixed reviews, the U.K., Germany, and Spain apparently headed for a recession, and continuing turmoil in emerging markets, sometimes I am surprised to see any green at all on my screen.
On the other hand, I’m sure some are wondering how close we can be to a collapse in the world’s financial system if the VIX is trading in the 24s.
It’s a valid question – and one I have addressed in the past on the blog with the benefit of several indicators which help evaluate how much complacency is in the market. One of these is a ‘fearogram,’ which measures the ratio of changes in the VIX to changes in the SPX. A similar tool is the VIX:SDS ratio, which compares the relative movements of the VIX and SDS (the double inverse ETF for the SPX) to historical patterns.
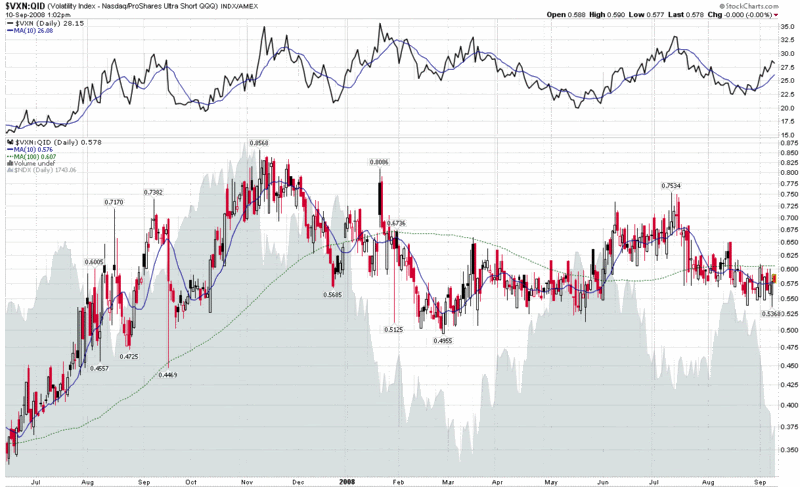
Below I have created a chart of the VXN:QID ratio, a sister to the VIX:SDS ratio. This chart compares volatility in the NASDAQ-100 index (NDX) to the double inverse ETF for the NDX. There are (at least) three ways to think about complacency in this chart:
- the absolute level of the ratio
- the level of the ratio relative to the 10 day simple moving average
- the level of the ratio relative to the 100 day simple moving average
Looking at the chart, consider that lower readings generally correspond to lower levels of complacency (i.e., less volatility and fear per unit of decline). The current ratio is moderately low on an absolute scale, but is lodged neatly between the 10 and 100 day SMAs. What I find particularly interesting about the chart is that in those instances in which the VXN has experienced a sustained rise over a period of several weeks or more (see top section of graphic), the current situation is the first time the ratio has not risen on par with the VXN. This development is a divergence worth watching and one which appears to favor the bears.
[source: StockCharts, VIX and More]
Thanks to all who responded to my call for help about creating blog posts in Word and publishing them to Blogger. For the record, this is my first post using Windows Live Writer, which has been up to the task so far...




