Showing posts with label QID. Show all posts

Monday, January 5, 2009

Direxion Triple ETFs Add New Horses to Stable

While skeptics abound about the usefulness of triple ETFs for the long-term investor, I have been saying since early on that the Direxion triple ETFs would revolutionize day trading.

Now that their novelty has worn thin and traders have had an opportunity to experiment with various approaches to trading triple ETFs, these vehicles have become an integral part of the day trading scene, particularly on trend days.

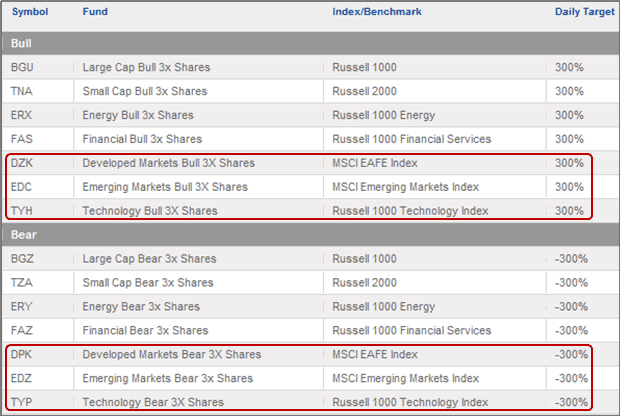
Looking to capitalize on the appeal of these nuclear-tipped trading weapons, Direxion added six new triple ETFs last month. While interest in the new round of ETFs has so far been limited, I predict at least one of the triple ETF pairs has a bright future. My candidates for stardom are the pair of emerging markets ETFs: the 3x bull (EDC) and the -3x bear (EDZ). The reason is simply a lack of competition. At the moment, competition comes in the form of EEV the -2x UltraShort MSCI Emerging Markets ETF from ProShares. While EEV is a popular double inverse ETF, it lacks a companion +2x version for those who want a leveraged bullish play on emerging markets without having to short EEV.

It is harder to see the other new ETF pairs attracting the same attention that the emerging markets are likely to receive. Technology is a favorite investment theme and a source of considerable volatility, but the current ROM (2x) and REW (-2x) have always been second tier ETFs in terms of popularity, lagging well behind QLD and QID, the popular NASDAQ-100 ETFs. The new Direxion entries, TYH (3x) and TYP (-3x) clearly have their work cut out for them.

Last but not least are a pair of ETFs based on the MSCI EAFE index of developed markets and the popular EFA ETF that tracks this index of European, Australasian and Far East companies. The 3x bull (DZK) and the -3x bear (DPK) have a lot of appeal to me as a means by which to speculate or hedge in non-U.S. companies, but whether these funds will receive the same kind of attention as EFA remains to be seen.

For the record, Direxion has outlined their intention to expand the stable of triple ETFs to 32 in their current prospectus. The ETFs currently in the pipeline have a strong international (China, India, Latin America, BRIC) and sector (clean energy, real estate, homebuilders) flavor. The graphic below shows the triple ETFs currently available, with the recent additions circled in red.

These ETFs are not for the faint of heart and anyone who considers trading these might want to read my initial post on the subject to get a sense of some of the risks involved.
[source: Direxion]

Friday, August 8, 2008

Increasing Options Volume in Double Inverse ETFs Crowding Out VIX Options?

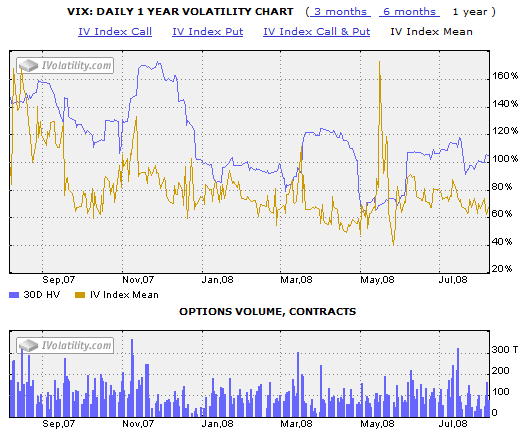
One year ago this month, VIX options peaked in popularity. As the graphic below from IVolatility.com shows, VIX options continue to trade at impressive volumes of about 100,000 contracts per day, but this number is about 30% below the levels from August-November of last year.


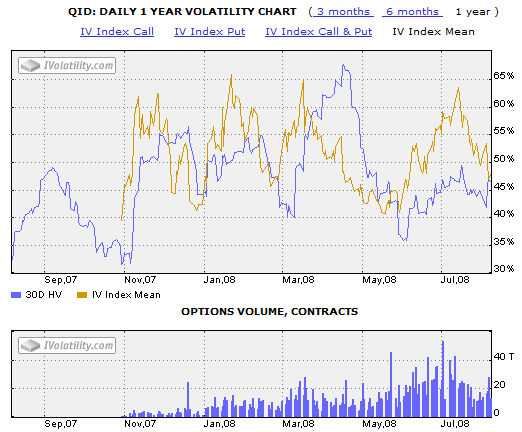
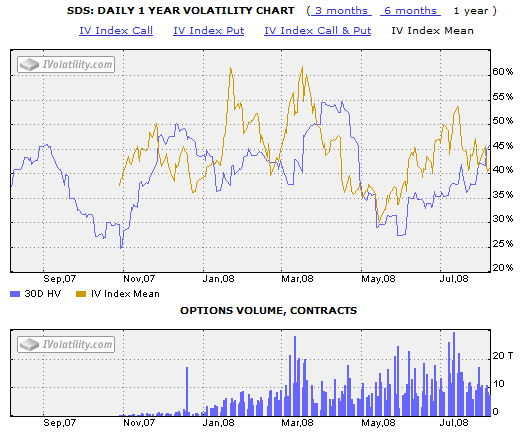
Part of the reason for this change in trading patterns is that some of the portfolio hedging trades formerly conducted with VIX options are now being redirected to options on double inverse ETFs. Back in February, in Interest in VIX Waning? I spoke about how the new trend seemed to favor QID options over VIX options. Six months later, the popularity of QID and SDS options persists, with QID + SDS options now accounting for approximately one third of the volume in VIX options.


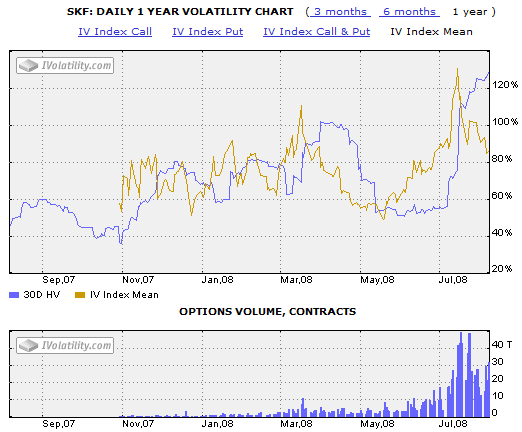
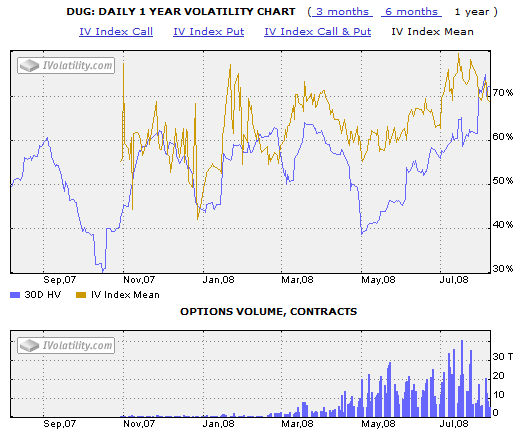
More recently, the rise of double inverse sector ETF options has translated into more choices for investors and lower market share for the VIX. While sector options are more likely than VIX options to be used for speculative purposes than as portfolio hedges, the surge in options volume for double inverse sector ETFs is worth highlighting here, with the SKF (double inverse sector ETF for financials) and DUG (double inverse sector ETF for oil and gas) receiving the most interest.

The rise of inverse and double inverse ETFs raises a number of questions about the VIX and poses some challenges for the index as a portfolio hedging tool and as a sentiment indicator. I will delve into these two subjects in more detail in the coming weeks and months.


Thursday, June 19, 2008

Keep an Eye on the QID Volume

The week’s trading volume has been on the thin side, particularly for an options expiration week. Of course, not all volume is created equal.

One the areas of the investment world where I pay close attention to volume is double inverse ETFs, which include the UltraShort ETFs pioneered by ProShares. The double inverse ETFs are an attractive set of investment vehicles for speculative bears to place their bets, because the oversized payoff if they are correct.

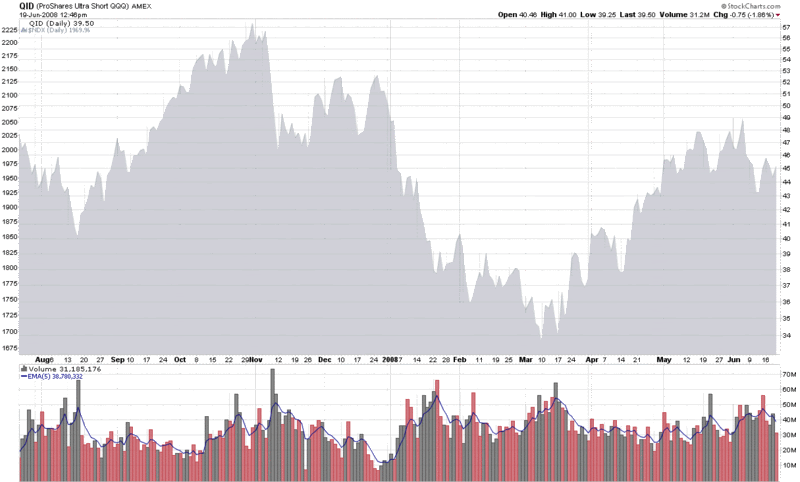
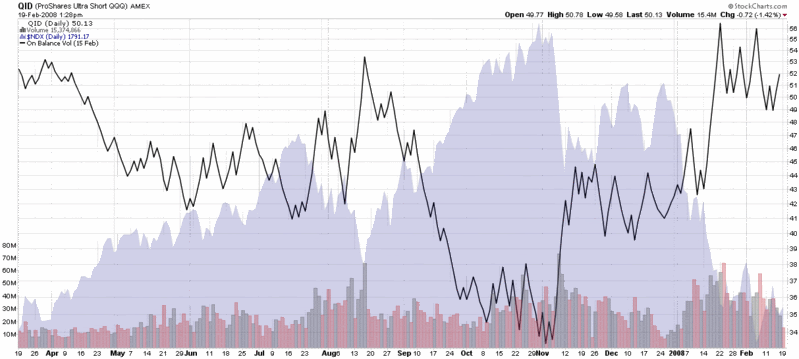
Of the double inverse ETFs, I am particularly fond of the QID, the double inverse ETF for the NASDAQ-100 index (NDX). The QID has captured the imagination of many retail investors who are not particularly comfortable going short, but have no qualms about making a bearish investment by going long an inverse ETF. Volume patterns in this ETF demonstrate that the QID can be an effective contrarian indicator. Take the chart below, for example, where a 5 day EMA of the volume has been a good indicator of tops in the NDX (the gray area chart on the top) when it rises above the 45-50 million share level.

In a broader sense, ETFs are opening up a new frontier for those who are interested in market sentiment. I will be sharing some of my thinking in this area in the weeks and months ahead.


Thursday, February 28, 2008

optionsXpress Trading Patterns and the VIX

One of the trading tools that satisfies my inner investment voyeur is the Trading Patterns feature at optionsXpress. If the “Trading Patterns” name doesn’t ring a bell, you might also know this feature as “People Trading ___ Also Traded…” in the spirit of Amazon’s recommendation technology and predecessor technology that dates back to internet pioneer Firefly Network Inc.

In the past, I have used the Trading Patterns data to see which companies were being most actively traded by those who are seeking high risk speculative momentum plays. I somewhat arbitrarily made BIDU the poster child for these momentum chasers and have twice looked at what those who were playing with BIDU were also trading.

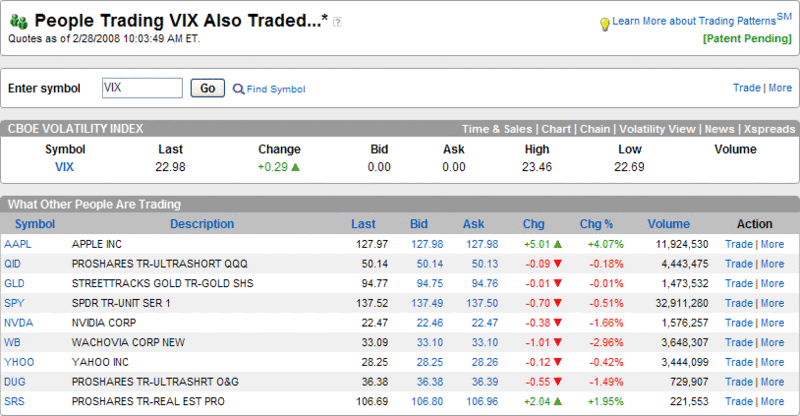
With all the discussion around potential substitutes for the VIX at least as a hedging tool, I thought it might be interesting to get a broader picture of those who trade VIX options. Thanks to Trading Patterns, I have captured just such a snapshot below. Not surprisingly, VIX traders are aggressive risk takers. In aggregate, they appear to be hoarding gold (GLD) and going short with the double inverse ETFs for real estate (SRS) and the NASDAQ-100 index (QID). It’s just a guess about the direction of some holdings, but the other positions appear to fall squarely in the short finance and technology camp: SPY, WB, AAPL, YHOO, and NVDA. The one finding that I see as somewhat surprising is the presence of the ProShares Ultrashort Oil & Gas ETF (DUG). Given the list of trading vehicles, I am concluding that the VIX players see oil and gas as overbought instead of a safe haven like gold. In any event, it is clear that the pessimism of VIX traders continues to be grounded in an expansion of the real estate and financial woes, the expectation that this will drag technology down with it, and the opinion that gold is the most sensible long position at the moment.

Friday, February 22, 2008

The Rising Popularity of XLF Options

Earlier in the week, I looked at the decreasing volume in VIX options in Interest in VIX Waning? Over the course of my analysis, I attributed some of the decline in VIX options to the launch of QID (and SDS) options back in November.

While the QID and SDS are undoubtedly stealing some market share from the VIX for those looking at leveraged hedging opportunities, a much bigger factor has been the meteoric rise in interest in options for XLF, the financial sector SPDR.

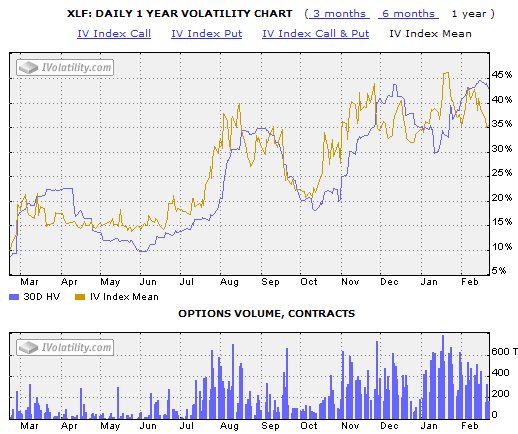
As the graphic below demonstrates, XLF options were not actively traded until July 2007. After a surge in interest in mid-summer, volume dropped off until November, at which time implied volatility and options volume both rose dramatically. By means of comparison, back in June 2007, XLF and VIX options traded in roughly equal numbers, but so far in 2008, XLF options volume has been outpacing VIX options volume by about five to one. Additionally, I find it noteworthy that a there has been a sustained increase in XLF options volume since the beginning of November – the same time that VIX options volume peaked and started to decline.

There are several other features of the XLF implied volatility chart that are worth pointing out. One of which is that implied volatility and options volume have moved in almost perfect lockstep over the past six months. Another point of interest is that XLF implied volatility peaked just as the major indices bottomed in January. A break below the current 35 support level might signal a lessening of put activity in the financial sector and perhaps indicate that the January bottoms are a good bet to hold.

Tuesday, February 19, 2008

Interest in VIX Waning?

A number of readers have wondered whether the recent lack of volatility in the VIX in the face of a strong market downturn indicates that the VIX is losing some of its relevance. This is a fair question.
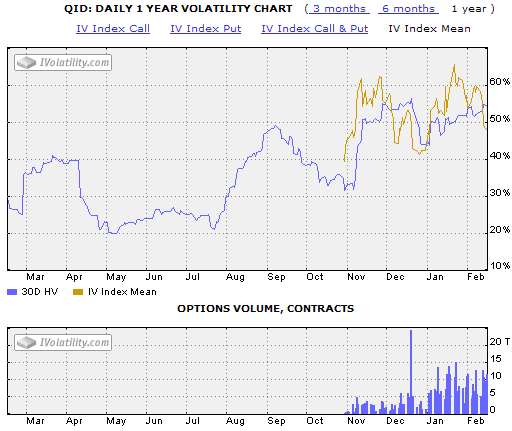
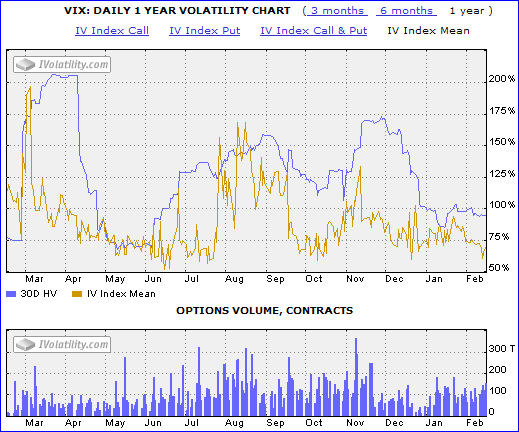
As the graphic to the right indicates, not only is the implied volatility and historical volatility of the VIX currently hovering near 52 week lows – when clearly investor fear is not similarly lax – but since about mid-November or thereabouts, the volume of VIX options traded has dropped dramatically as well. In fact, with the benefit of hindsight, it appears that the popularity of VIX options surged from May through November of 2007, only to have recently returned to the levels that preceded the anxiety over the subprime problems and all the dominoes since uncovered that appear to have been within tipping range.

Of course, if the VIX’s beta starts dropping below historical levels, it is possible that we may have a situation in which, as I described previously, the less the VIX moves, the less valuable (reliable) it becomes as a highly leveraged hedge against long market positions.

One of the theories about the lack of action in the VIX is that those who are looking for another way to have a highly leveraged hedge have flocked to the inverse and double inverse ETFs. Did anything happen in November that might support that theory? Well, lo and behold, it turns out that the most popular of the double inverse ETFs, the QID, just happened to start trading options in November. Coincidence? I suspect not. While the volume of QID options relative to VIX options is rather small, clearly the game has changed.

This observation is not going to persuade me to change the name of the blog, but don’t be surprised if you see me posting about the QID more often. After all, as the chart on the bottom shows, QID volume (and on balance volume) has demonstrated considerable predictive potential over the past year.


Wednesday, January 16, 2008

Volatility RIP?

I have talked rather extensively about the surprising lack of volatility in the markets during the past month or so, particularly given the sharpness of the current downturn and the preponderance of gloom and doom news out there. For a little while, at least, it was possible to ignore this phenomenon and chalk it up to “calendar reversion.” Now that the holiday season is behind us, this explanation no long holds water and it seems everyone wants to know why the VIX just sits there in the low to mid-20s.


For those interested in the evolution of my thinking on this subject, I encourage your to consider reading Not a Lot of Fear or Volatility Lately (11/27/07); No Fear (12/19/07); The Incredible Shrinking VIX (12/21/07); VIX Shrinkage Continues… (12/24/07); The Low Fear Selloff (1/4/08); and VWSI at Zero as VIX Meanders (1/14/08).

The bottom line is that I cannot explain why the volatility indices appear to be relatively indifferent to what many think is the beginning of a nasty bear market. Of course, this relative complacency would be possible only if investors as a whole were not worried about a bear market – and when was the last time that investors failed to panic when the markets turned down sharply?

While I have no answers, per se, I do have a few working hypotheses that I tweak from time to time, in no particular order:

  1. increased use of inverse and double inverse ETFs (i.e., QID) for hedging/speculation

  2. the expectation of a forthcoming emergency rate cut limiting upside potential for puts

  3. the possibility that there has been so much advance warning about a potential market meltdown that those who have wanted to protect their portfolio and/or speculate on a downside move have had ample time to do so, at their leisure

  4. a vicious cycle in which the less the VIX moves, the less valuable (reliable) it is as a hedge (or highly leveraged hedge)

If and when I can come up with a better answer to this question, I will cut in with a live feed from Volatility Central…

Monday, January 14, 2008

VWSI at Zero as VIX Meanders

There is probably a better word out there to describe the recent lack of action in the VIX, but I’m going to stick with ‘meander’ for now. After weekly changes of 9% or more in one direction or the other for 11 out of the past 12 weeks, the VIX dropped a mere 0.26 (1.1%) last week to end the week at 23.68. Perhaps more important, in spite of those 12 relatively volatile weeks, last week’s close leaves the VIX just 0.10 above the 50 day SMA, indicating that this has been a lot of running hard simply to stay in the same place.

The VIX Weekly Sentiment Indicator (VWSI) is as unimpressed by the recent market downturn as the VIX, currently registering a zero, which indicates no bias toward increasing volatility.

As is my weekly custom, for a survey of the best in current thinking about the markets, Barry Ritholtz at The Big Picture sums up the week that was and the week that will be in his Mid January Linkfest: Review / Preview.

Looking forward, I am still puzzling over the implications of the recent lackluster VIX. Three possible conclusions immediately jump out at me:

  1. the markets have a lot longer to fall and won’t bottom until we have a meaningful VIX spike (I consider this possible, but certainly not a fait accompli, as I spelled out in Can the Markets Bottom Without a VIX Spike?);

  2. investors are not particularly fearful at the moment because after six months of hearing about an upcoming disaster have bought all the puts they want and/or are getting desensitized to additional bad news;

  3. the VIX no longer has the predictive value it once had, due in part to the flourishing of double inverse ETFs like the QID and other increasingly popular instruments for the bearishly inclined.

I will be evaluating all three possibilities going forward and will update my thinking here as it evolves.

(Note that in the above temperature gauge, the "bullish" and "bearish" labels apply to the VIX, not to the broader markets, which are usually negatively correlated with the VIX.)

Wine pairing: For a VWSI of zero, I began 2007 by recommending some Rhone blends and later expanded the category to include any expensive blend. Over the course of the year, my two favorite inexpensive blends turned out to be the $8 Oakley Five Reds (the 2003 vintage is a blend of 41% syrah, 27% zinfandel, 22% petite sirah, 10% alicante bouschet, and 1% mourvedre from Cline Cellars); and the 2005 vintage of The Hermit Crab from D’Arenberg, a delicious $13 blend of 70% viognier and 30% marsanne.

Tuesday, January 8, 2008

The Fallacy of the Bearish First Five Days

I will be the first to admit that one of my favorite trading books to browse through is the Stock Trader’s Almanac, complied by Jeffrey Hirsch and Yale Hirsch. The current version of this annual classic, Stock Trader’s Almanac 2008, has already been sitting on my desk for three months.
I mention this book because the authors have been instrumental in widely disseminating the idea of the ‘January Baromenter,’ which posits that “as goes January, so goes the market.” While the idea of the January Barometer dates back to at least 1972, the corollary, which should be on the mind of many investors today, is that the first five days of January provide an effective ‘early warning system’ about the trend for the balance of the year.

Before I critique these two ideas, let me point out that the data for the general premise of January as a microcosm of a full trading year is compelling. Using the S&P 500 index, the January Barometer includes only five major errors in the past 58 years; and 31 of the last 36 times the first five days were up, the year ended up as well.

But before you load up on more QID in anticipation of the market being sucked into a black hole, it is important to recognize that the data obscures what happens when the year gets off to a particularly ugly start, as it has in the first four trading days of year (through yesterday), where the SPX has been down 3.6%.

As it turns out, since 1950 the SPX has only had a five day start that was worse than 2008 on two occasions: 1978 and 1991. In both cases, however, the year managed to turn around and finish in the green. In 1978, the SPX shook off a -4.7% first five days and was up 6.0% the rest of the year. The turnaround in 1991 was even more dramatic, as anyone who owned NASDAQ stocks (up 56.8% that year) will surely recall. After falling 4.6% the first five days of 1991, the SPX was up 32.5% for the remainder of the year.

If one wants to expand the analysis to the worst full month starts since 1950, the four worst of these starts also turned around by the end of the year as well. In 1970, January was down 7.6%, but the balance of the year was up 8.4%. In 1960, it was -7.1% followed by +4.5%; in 1990 it was -6.9% and +0.3%; and in 1978 it was -6.2%, with a +7.7% turnaround from February through December.

As always, be careful with what you take away from this analysis. Of the 21 Januarys that the SPX has been down, the balance of the year was down 10 times and up 11 times. The bottom line? If there is any message worth remembering from the data above, it is that good starts tend to persist, ugly ones tend to reverse, and slightly down beginnings run the greatest risk of turning into a rout.

Tuesday, February 13, 2007

Why an Entire Blog Dedicated to the VIX?

Someone has to be wondering about this, even if I haven’t been asked yet.

Here is the reasonably concise answer:

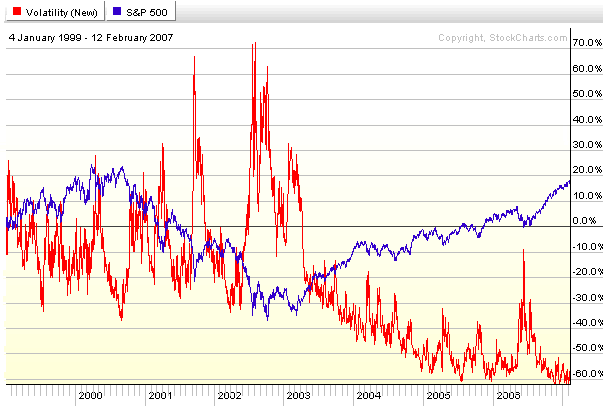
In December 2006, I began wondering when we were going to have a correction from the July rally (I’m still wondering) and set about to look at a bunch of sentiment and other contrary indicators that might support my case. One that particularly caught my attention was the VIX, not just because of the obvious negative correlation to the SPX (see graph below), but also because options are actively traded in the VIX and could provide a more leveraged play than say the QID in a nasty downturn. I did some Googling and concluded that if there are any VIX ‘experts’ out there, they are certainly not a publicity-seeking bunch.

So I download the VIX price history data to Excel and started playing around with it. I posted some observations on an InvestorVillage forum and decided that a blog would be a much more convenient way to archive my thoughts.

That’s about it.

I find it ironic that I now have a VIX blog and am now thinking regularly about implied volatility issues, as I am not an “options guy” per se, having traded almost exclusively equities for the past 20 years, with the exception of an occasional outright purchase of a call or a put, and a rare covered call play. Only in the past month have I made my first foray into (bear call) spreads.

So that is why I call this a “learning laboratory of sorts.”

Initially, I thought I might tackle a wide variety of sentiment-related issues, but since Zen’s Market Insights, HeadlineCharts, and others do such a good job of covering the waterfront there, is not a high priority for me at this stage.

I will, however, experiment with the “and More” portion of this blog soon enough. Hell, espn has never figured out what to do with the “e” at the beginning of their name, so I am not worried about how long it takes me to sort it out.

Thanks to all who have contributed here in one way or another.

As always, comments and suggestions are welcome.

DISCLAIMER: "VIX®" is a trademark of Chicago Board Options Exchange, Incorporated. Chicago Board Options Exchange, Incorporated is not affiliated with this website or this website's owner's or operators. CBOE assumes no responsibility for the accuracy or completeness or any other aspect of any content posted on this website by its operator or any third party. All content on this site is provided for informational and entertainment purposes only and is not intended as advice to buy or sell any securities. Stocks are difficult to trade; options are even harder. When it comes to VIX derivatives, don't fall into the trap of thinking that just because you can ride a horse, you can ride an alligator. Please do your own homework and accept full responsibility for any investment decisions you make. No content on this site can be used for commercial purposes without the prior written permission of the author. Copyright © 2007-2023 Bill Luby. All rights reserved.
 
Web Analytics