Showing posts with label NVDA. Show all posts

Tuesday, June 25, 2024

QQQs and DJIA Correlation Turns Strongly Negative

If it seems that recently the NASDAQ-100 Index and the venerable Dow Jones Industrial Average (DJIA) are moving in almost mirror images of each other…that is because that is exactly what is happening.  

The graphic below, courtesy of ETFReplay.com, shows the 10-day rolling correlation between the DIA ETF and the QQQ ETF over the course of the past twenty years.  Note that the current correlation of 0.55 is not only extremely negative, but it is more negative than it has been in 20 years of recorded data, with a dramatic acceleration of that negative correlation during the past week.


[source(s): ETFReplay.com]

Behind this issue is NVDA, which peaked at 141 last Thursday and sold off more than 16% as of yesterday, dragging down QQQ in the process.  In a related development, artificial intelligence (AI) stalwart Broadcom (AVGO) peaked one week ago today at 1852 before pulling back 16% as of this morning.  During this period, the DJIA was rising steadily, as investors pulled money from the AI superstars and other related growth areas and reallocated it in blue chip growth areas, like the Dow stocks.  If this trend holds, then market breadth will continue to improve and we will witness sector rotation, style rotation and factor rotation as well.  The problem is that the next AI/growth scare could not lead to rotation, but to widespread selling across the full spectrum of stocks.  There are no indications that indiscriminate selling is just around the corner, but if the next round of selling coincides with the QQQ-DIA correlation returning to the typical +0.70 to +0.75 range, the risks of broad and sharp selloff go up dramatically.

Further Reading:
Index Volatility and Component Correlation
Correlation Ideation
CBOE Launches Implied Correlation Index

For those who may be interested, you can always follow me on Twitter at @VIXandMore

Disclosure(s): long NVDA, AVGO and QQQ at time of writing


Thursday, February 28, 2008

optionsXpress Trading Patterns and the VIX

One of the trading tools that satisfies my inner investment voyeur is the Trading Patterns feature at optionsXpress. If the “Trading Patterns” name doesn’t ring a bell, you might also know this feature as “People Trading ___ Also Traded…” in the spirit of Amazon’s recommendation technology and predecessor technology that dates back to internet pioneer Firefly Network Inc.

In the past, I have used the Trading Patterns data to see which companies were being most actively traded by those who are seeking high risk speculative momentum plays. I somewhat arbitrarily made BIDU the poster child for these momentum chasers and have twice looked at what those who were playing with BIDU were also trading.

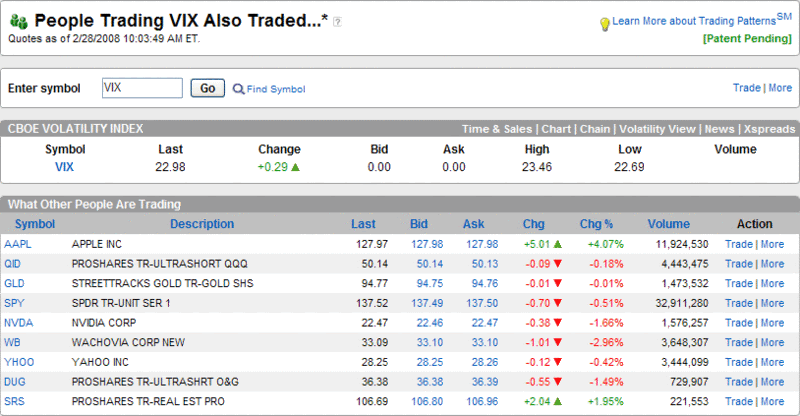
With all the discussion around potential substitutes for the VIX at least as a hedging tool, I thought it might be interesting to get a broader picture of those who trade VIX options. Thanks to Trading Patterns, I have captured just such a snapshot below. Not surprisingly, VIX traders are aggressive risk takers. In aggregate, they appear to be hoarding gold (GLD) and going short with the double inverse ETFs for real estate (SRS) and the NASDAQ-100 index (QID). It’s just a guess about the direction of some holdings, but the other positions appear to fall squarely in the short finance and technology camp: SPY, WB, AAPL, YHOO, and NVDA. The one finding that I see as somewhat surprising is the presence of the ProShares Ultrashort Oil & Gas ETF (DUG). Given the list of trading vehicles, I am concluding that the VIX players see oil and gas as overbought instead of a safe haven like gold. In any event, it is clear that the pessimism of VIX traders continues to be grounded in an expansion of the real estate and financial woes, the expectation that this will drag technology down with it, and the opinion that gold is the most sensible long position at the moment.

DISCLAIMER: "VIX®" is a trademark of Chicago Board Options Exchange, Incorporated. Chicago Board Options Exchange, Incorporated is not affiliated with this website or this website's owner's or operators. CBOE assumes no responsibility for the accuracy or completeness or any other aspect of any content posted on this website by its operator or any third party. All content on this site is provided for informational and entertainment purposes only and is not intended as advice to buy or sell any securities. Stocks are difficult to trade; options are even harder. When it comes to VIX derivatives, don't fall into the trap of thinking that just because you can ride a horse, you can ride an alligator. Please do your own homework and accept full responsibility for any investment decisions you make. No content on this site can be used for commercial purposes without the prior written permission of the author. Copyright © 2007-2023 Bill Luby. All rights reserved.
 
Web Analytics