A reader asked about how to get up and running with sentiment indicators, where to get data, what time frames to use, etc. Since this is not a subject I have broached here, let me use this opportunity to provide an initial overview of some of my thoughts on sentiment indicators.
In terms of context, I consider fundamental analysis, technical analysis and market sentiment analysis to be the three primary legs of the investment stool. I believe it is a common pattern for relative newcomers to the investing world to begin with a fundamental analysis perspective, start wondering why individual stock don’t move ‘like they should,’ then add some technical analysis tools. Often it takes awhile to get the hang of TA; once they do, most investors get blindsided when thee entire forest moves abruptly while they are focusing on an individual tree or two. This is often the catalyst that leads to a more in-depth examination of market sentiment indicators.
Sentiment as a Contrarian Indicator
With that out of the way, where should you start with investor sentiment? First, keep in mind that much of market sentiment is a contrarian tool. One of my favorite quotes comes from John Bender in Jack Schwager’s Stock Market Wizards, “It’s not the current opinion on the stock that matters, but rather the potential change in the opinion that matters.” When your great aunt, housekeeper and taxi driver all start telling you how much money they are making in the stock market, who is left to buy and drive prices up further? On the other hand, if most of the people you know confess to having recently lost over half of their money in the market and swear about “never investing in stocks again,” then the markets have probably just about run out of sellers.
By all means, keep tabs of anecdotal evidence from novice investors you know and consider how much easy money you could make by taking the other side of every trade that a novice investor makes.
Types of Sentiment Indicators
In a nutshell, sentiment indicators attempt to discern what unsophisticated investors are thinking, feeling and doing, then encourage you to take the opposite position when their fear or greed reaches extreme levels.
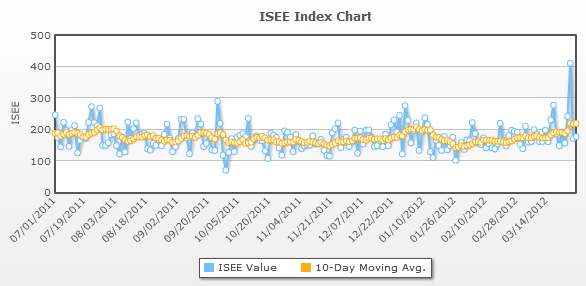
Some sentiment indicators are compiled based on a direct survey of investors to determine if they are bullish or bearish. Three of the more famous of these are Investors Intelligence, the American Association of Individual Investors (AAII) and Market Vane. Newer additions to the fold are Birinyi’s Blogger Sentiment Poll and LowRisk.com’s Investor Sentiment Indicator. Since we know that what some people say and actually do are often two very different things, much of sentiment analysis looks at the activity of supposedly unsophisticated investors in order to get a better sense of which direction they are leaning. The ISEE (call to put ratio) is one such measure of investor activity; the CBOE Equity put to call ratio is another; and the Public Short Sales data is another good data point. To the extent you are able to, use ratios and other tools to compare and contrast the actions of the ‘little guy’ with that of institutions.
Sentiment Data Sources
In terms of sources, StockCharts.com has a great (and free) Market Summary page that is an excellent snapshot of what is going on in the 100+ most important markets, sectors, countries, etc. Scroll down to the bottom two groups and you'll find many sentiment indicators I follow in the "Market Breadth" section. You may or may not already be familiar with the "Bullish Percent Indices" – if you aren't, these are something you should take some time to educate yourself on in the future. Each indicator has links to three kinds of charts – and if you click directly on the name of the indicator, you will pull up the default gallery view.
Another excellent free site with a different set of indicators can be found at Market Gauge - Today's Indicators. I keep an eye on the “Contrary Opinion” data, in particular. Note that each line has a chart link in the far right hand side of the page. You may want to also bookmark Market Gauge's Market Summary page. Finally, I only recently discovered InvestmentTools.com, which has some superb “Weekly Sentiment Indicators” as well as some valuable “Short Sales” data.
Two other recommended sources for market sentiment are Market Harmonics (consider the "Volume" and "Momentum" data at some point in the future too) and the "Power Tools" at SchaeffersResearch.com. Once again, start with the “Sentiment Data” section, but eventually look at the others as well. In terms of blog sources, HeadlineCharts probably does more with market sentiment than any of the others I read and TheSentimentals.com has as comprehensive a list of links to market sentiment data as I have seen. For a weekly recap of sentiment data and a commentary on what is happening in the world of sentiment and market internals, check out Fred Ruffy's "Sentiment Journal" column at Optionetics.com.
Whenever possible, I suggest you get data directly from the exchanges, such as ISEE data from the ISE and CBOE VIX data and CBOE Put/Call ratio data from the CBOE. You can download historical data from Yahoo in spreadsheet format for the likes of the VIX and many other indices. As a rule, you should try to get this same data from an exchange or web site dedicated to this index first and use Yahoo only as a last resort.
Sentiment and Time Frames
Regarding time frames, your typical holding period should dictate the time frames you look at. Are most of your trades day trades? swing trades of 2-10 days? have holding periods of 1-3 months? Maybe you trade in multiple time frames (dangerous and confusing at times, but ultimately not necessarily a bad thing to do.)
I have never seen anyone articulate this, but my personal experience is that the charting time horizon for support, resistance, moving averages, recognition of common patterns, etc. ought to be something on the order of 20-50x your typical holding period. Most of my trades are of the 2-10 day variety, so most of the charts I look at are in the 20 day to 1 year range. I like to look at charts of 2 years or more for historical perspective on candidates I have already screened and I sometimes to go down as low as 1 minute bars for intra-day charts to fine tune entries and exits, but for the most part, I live in the 1-6 month charting world. Typically the longer term charts identify the opportunity and the shorter term charts trigger the timing of the entry.
I rarely care much about intra-day sentiment and look at a lot of moving averages in the 5, 10 and 20 day range, sometimes up to 200 days/40 weeks. Your sentiment time horizon should probably match your overall charting time horizon, but I haven't found much bang for my energy/attention buck focusing on intra-day or even day to day sentiment movement. Look for some smoothing factor, such as simple or exponential moving averages, to help minimize the noise.
On-Line Resources and Books
Regarding books and other educational sources, I can't say I have any great ones up my sleeve.
As noted earlier, for an on-line source, StockCharts.com does as good a job as anyone in terms of education. I would definitely start with their Introduction to Market Indicators and go from there, perhaps backing up to their entire Chart School series. You should probably bookmark their Glossary for future reference too.
For a broad brush perspective on sentiment indicators, I highly recommend that you check out an excellent post by Barry Ritholtz of The Big Picture, "Contrary Indicators 2000 - 2003 Bear." You should also download the full PDF or Word document that he links to and study the analysis of various internal and external indicators, then look at some of these and how they performed in and around May-July 2006 as well as around February 2007 – or any other period you are interested in.
If you want a treasure trove of ideas on sentiment, I heartily recommend a visit to TraderFeed.com, where a keyword search on "sentiment" will provide you with many hours of reading from the archives of Brett Steenbarger. If this is news to you, then you just aren't paying attention...
I am embarrassed to admit that I have not yet bothered with the free trial of Jason Goepfert's SentimenTrader.com, but from what I have seen of his work, I would recommend you test drive his site with a free trial. At a minimum, follow the link above to see what sort of indicators he thinks are worth following.
The last time I did a summary of recommended investment books was about 9 months ago. I need to update that list and put it on the blog, but I can tell you that there is not a great book on investor sentiment in there. Gary Smith’s How I Trade for a Living is probably my favorite treatment of market sentiment. Though it is not on the above list, I thought Toni Turner did an excellent job with sentiment and many other topics in Short-Term Trading in the New Stock Market. For my money, Turner’s book is one of the better ones for a relative newbie, albeit with a definite short-term bias. Two other books worth checking out for their discussion of sentiment issues are Martin Pring's encyclopedic Technical Analysis Explained: The Successful Investor's Guide to Spotting Investment Trends and Turning Points and New Thinking in Technical Analysis: Trading Models from the Masters, a patchwork of ideas from many respected thinkers, edited by Rick Bensignor, which includes a chapter on sentiment by Bernie Schaeffer, "Enhancing Technical Analysis by Incorporating Sentiment."