Showing posts with label seasonality. Show all posts

Sunday, November 3, 2013

The Evolution of the Holiday Effect in VIX Futures

[The following originally appeared in the November 2012 edition of Expiring Monthly: The Option Traders Journal. I thought the contents might be timely in light of the upcoming holiday season.]

With fewer trading days and a historical record that favors an uptick in stocks and a downtick in volatility, the end of the year never fails to present an intriguing set of trading opportunities.

One phenomenon related to the above is something I have labeled the “holiday effect,” which is the tendency of the CBOE Volatility Index (VIX) December futures to trade at a discount to the midpoint of the VIX November and January futures.

This article provides some historical analysis of the holiday effect and analyzes how the holiday effect has been manifest and evolved over the course of the past few years.

Background and Context on the Holiday Effect on the VIX Index

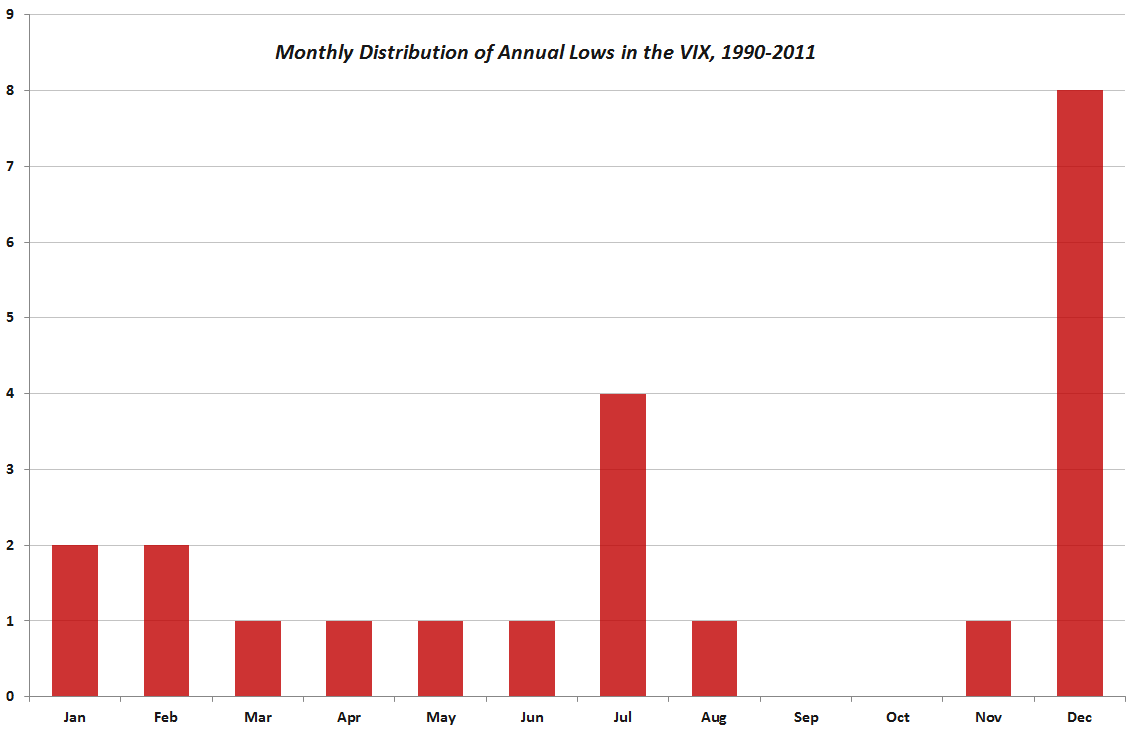
Part of the explanation for the holiday effect is embedded in the historical record. For instance, in eight of the last twenty years, the VIX index has made its annual low during the month of December. In fact, the VIX has demonstrated a marked tendency to decline steadily for the first 17 trading days of the month, as shown below in Figure 1, which uses normalized VIX December data to compare all VIX values for each trading day dating back to 1990. Not surprisingly, those 17 trading days neatly coincide with the typical number of December trading days in advance of the Christmas holiday.

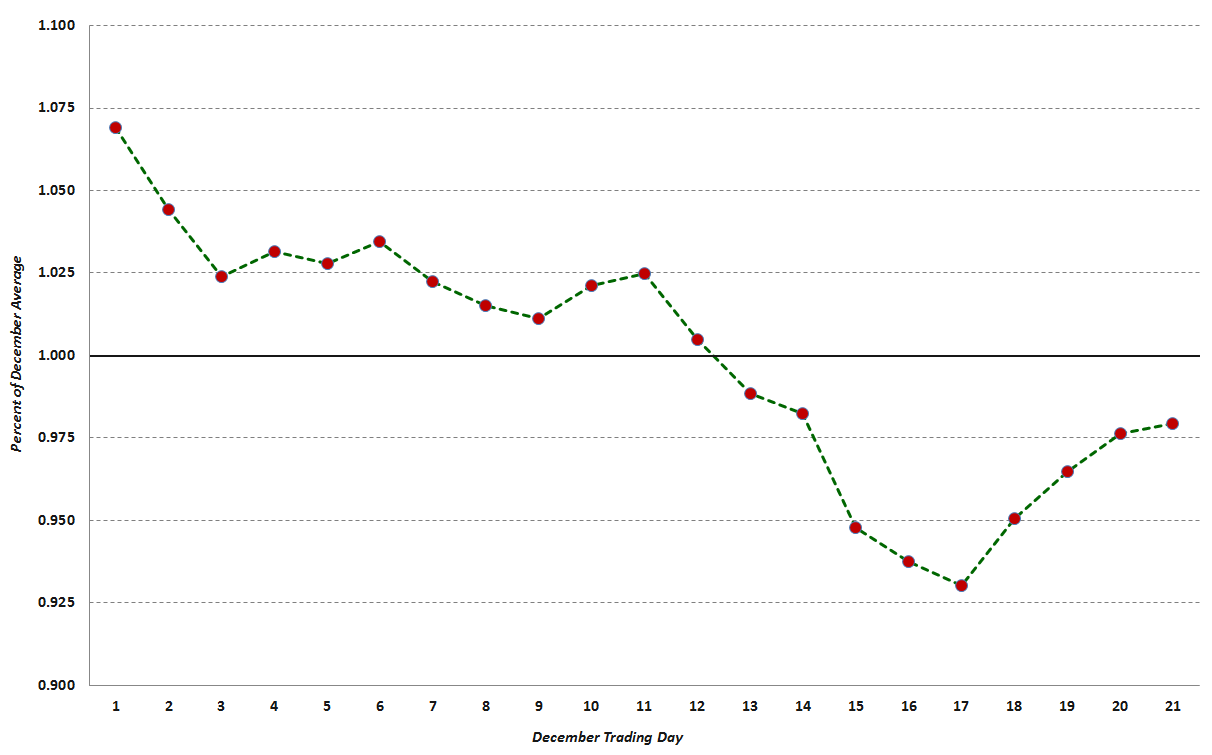
{Figure 1: The Composite December VIX Index, 1990-2011 (source: CBOE Futures Exchange, VIX and More)}

Readers should also note that, on average, the steepest decline in the VIX usually occurs from the middle of the month right up to the Christmas holiday.

The December VIX Futures Angle

Most VIX traders are aware of the tendency of implied volatility in general and the VIX in particular to decline in December. As a result, since the launch of VIX futures in 2004, there has usually been a noticeable dip in the VIX futures term structure curve for the month of December. Figure 2 below is a snapshot of the VIX futures curve from September 12, 2012. Here I have added a dotted black line to show what a linear interpolation of the December VIX futures would look like, with the green line showing the 0.50 point differential between the actual December VIX futures settlement value of 20.40 on that date and the 20.90 interpolated value, which is derived from the November and January VIX futures contracts. (Apart from the distortions present in the December VIX futures, a linear interpolation utilizing the first and third month VIX futures normally provides an excellent estimate of the value of the second month VIX futures.)

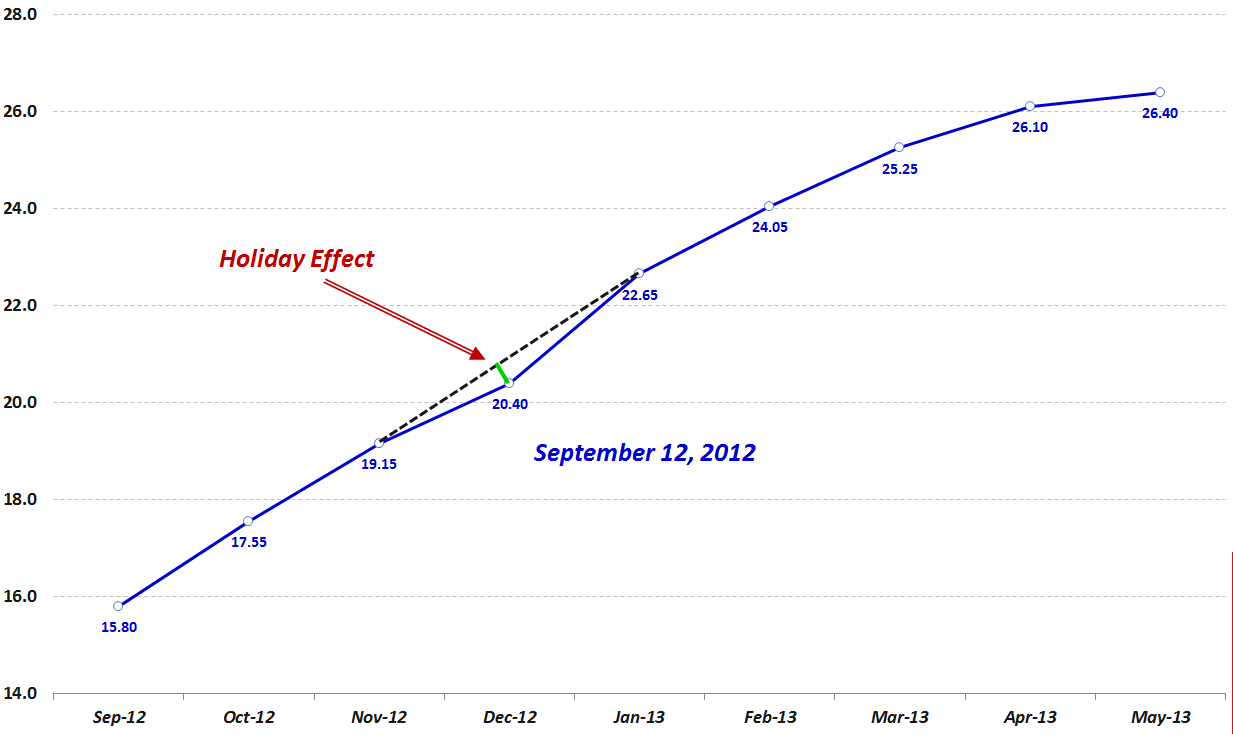
{Figure 2: VIX Futures Curve from September 12, 2012 Showing Holiday Effect (source: CBOE Futures Exchange, VIX and More)}

Looking at the full record of historical data, the mean holiday effect for all days in which the November, December and January futures traded is 1.87%, which means that the December VIX futures have been, on average, 1.87% lower than the value predicted by a linear interpolation of the November and January VIX futures. Further analysis reveals that on 91% of all trading days, the December VIX futures are lower than their November-January interpolated value. The holiday effect, therefore, is persistent and substantial.

The History of the Holiday Effect in the December VIX Futures

Determining whether the holiday effect is statistically significant is a more daunting task, as there are only six holiday seasons from which one can derive meaningful VIX futures data. Figure 3 shows the monthly average VIX December futures (solid blue line) as well as the midpoint of the November and the January VIX futures (dotted red line) for each month since the VIX futures consecutive contracts were launched in October 2006. Here the green bars represent the magnitude of the holiday effect expressed in percentage terms, with the sign inverted (i.e., a +2% holiday effect means that the VIX December futures would be 2% below the interpolated value derived from November and January futures.)

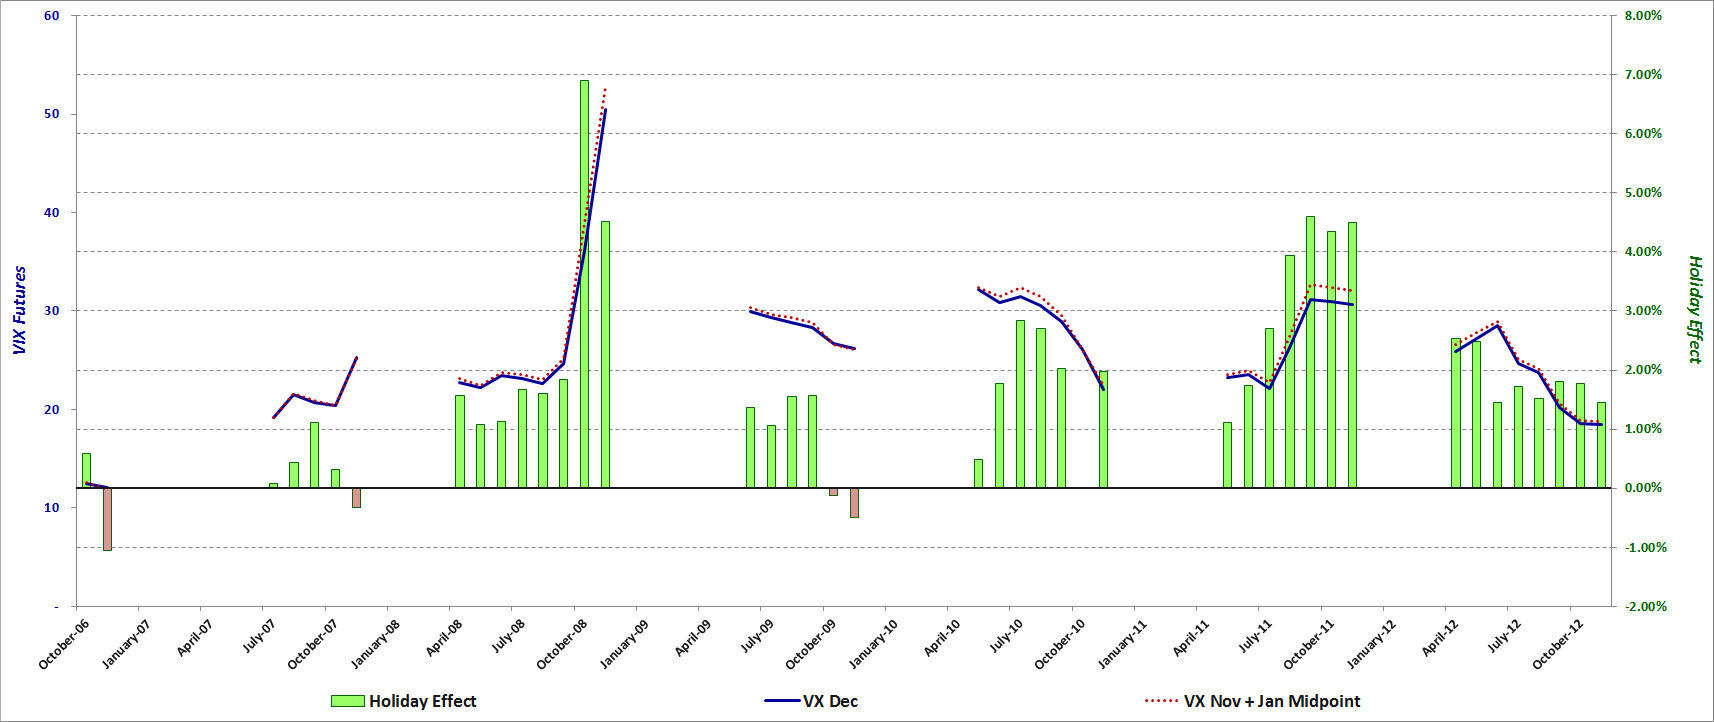
{Figure 3: VIX December Futures Holiday Effect, 2006-2012 (source: CBOE Futures Exchange, VIX and More)}

Conclusions

With limited data from which to draw conclusions, it is tempting to eyeball the data and look for emerging patterns which may repeat in the future. Clearly one pattern is that an elevated or rising VIX appears to coincide with a larger magnitude holiday effect, whereas a depressed or falling VIX is consistent with a smaller holiday effect. The data is much less compelling when one tries to determine whether the time remaining until the holiday season has an influence on the magnitude of the holiday effect. While one might expect the holiday effect to become magnified later in the season, the evidence to support this hypothesis is scant at this stage.

To sum up, investors have readily accepted that a lower VIX is warranted for December and the downward blip in December for the VIX futures term structure reflects this thinking. As far as whether this seasonal anomaly is tradable, there is still a limited amount of data – not to mention some highly unusual volatility years – from which to develop and back test a robust VIX futures strategy designed to capture the holiday effect.

In terms of trading the holiday effect for the remainder of the year, the coming holiday season is also complicated by matters such as the fiscal cliff deadline and various euro zone milestones that are set for early 2013. In fact, there may not be a reasonable equivalent since the Y2K fears in late 1999 that turned out to be a volatility non-event when the calendar flipped to 2000.

While the opportunities to capitalize on the 2012 holiday effect may be difficult to pinpoint and fleeting, all investors should be attuned to seasonal volatility cycles as 2013 unfolds and volatility expectations ebb and flow with the news cycle as well as the calendar.

Related posts:

Other articles republished from Expiring Monthly:

Disclosure(s): none

Tuesday, June 19, 2012

Tracking the Fall in VIX Futures

The last four days have seen a dramatic decline in all things related to the VIX. The cash/spot VIX is down 26% from last Wednesday’s close as I write this and the VIX futures have followed the VIX down to varying degrees. The graphic below shows the changes in all the VIX contracts during the last four days – a period during which the entire VIX futures term structure has fallen sharply.

As is usually the case, the decline in the front month (June) contract is the sharpest of the group and has actually exceeded the decline in the cash/spot VIX during the same period. With the June contract set to expire at the open of trading tomorrow, it is not surprising that the contract have been as volatile as the VIX index in the last few days. Note that at the other end of the term structure, the back month (February 2013) VIX futures contracts have fallen only 6.8%, about ¼ of the decline seen in the front month futures. Given where we are in the current expiration cycle (right at the very end), the changes in the other months relative to the front month VIX futures are in line with historical norms.

Sharp-eyed readers will no doubt note evidence of the Holiday Effect in the dip in the December contract, where fewer trading days and bullish seasonal factors have a tendency to dampen volatility – and volatility expectations. [Which raises the question of whether the European sovereign debt crisis and the U.S. fiscal cliff will observe the holidays this year, but that is a post for another time…]

The bottom line is that even with the VIX hovering around the 18.00 line, investors are still anticipating a VIX in the 29-30 range for the beginning of 2013. While this may sound high to some, it is down from expectations of a VIX of 31-32 just last week.

One thing I am certain of: there will be a fair amount of entertainment value just in watching the gyrations of the financial markets for the next few quarters. One other thing I am nearly certain of: when the VIX futures make big moves, new opportunities are bound to arise.

Related posts:

[source(s): CBOE, Interactive Brokers]

Disclosure(s): the CBOE is an advertiser on VIX and More

Tuesday, December 13, 2011

December Is the Cruelest Month…For the VIX

It seems well-nigh impossible for a December to pass without some sort of movements in the CBOE Market Volatility Index (the formal name of the VIX, for those who may have a short memory) that leave investors scratching their heads. In light of this, it appears I will be responsible for at least one December post reminding investors about the idiosyncrasies of implied volatility and the VIX during the holiday season.

There are a number of ways to look at the typical holiday swoon in the VIX, which I have labeled (the holiday effect or calendar reversion) for easy tagging and backtracking. From a strict fundamental perspective, the biggest change during the December/January holidays is fewer trading days, which means a shorter runway for stocks to depart for some unusual destinations. The other big factor is one of seasonality, specifically the tendency for December to be a bullish month for stocks.

I have chronicled how these factors influence the VIX and the strange prints they sometimes leave on the charts in posts from previous years (see links below.)

This year I am offering a chart which shows that in any given year, there is about a 40% chance that the VIX will make its annual low in December and as I discussed last year in VIX and the Week Before Christmas, the bottom usually comes in the last half of the month and most often just before Christmas.

In three trading sessions the VIX is already more than 20% off of its 30.91 close from last Thursday. It seems rather far-fetched to think that the VIX will plummet all the way below the current 2011 low reading of 14.27 from April 28th of this year (a date that is provisionally included in the chart below,) but stranger things have happened.

Even if you think the European sovereign debt crisis will see several more eruptions before the end of the year, don’t be surprised if the VIX is sleeping with the fishes for the next week or two.

Related posts:


Disclosure(s): none

[source:  CBOE, Yahoo]

Wednesday, July 1, 2009

Timing of VIX Bottom

Based on a number of factors, including my recent comments in VIX at Seasonal Cycle Low, I believe there is a very good chance the VIX may put in an intermediate-term bottom either today or tomorrow.

Friday, June 19, 2009

VIX at Seasonal Cycle Low

With the VIX now getting comfortable in the 20s, there has been a fair amount of discussion about just how low we can expect the VIX to go in the next few months.

Back in April, in The New VIX Macro Cycle Picture, I predicted that the VIX will likely not drop below the 25-27 area in the current bull market. That prediction has held up so far, but will almost certainly be tested during the summer months.

Most investors tend to think of the summer season as something of a horse latitudes of sorts for trading, with volume tailing off, portfolio managers on vacation and stocks sometimes set to cruise control. As a result, most people equate summer with lower volatility.

While the VIX does tend to follow a distinct seasonal cycle, the truth of the matter is that we are now at the seasonal cycle low, with volatility historically increasing dramatically from June through October. In fact, over the course of the past two decades the increase in volatility has been highest from June to July, increasing by over 10% (1.82 points.) The pattern is quite distinct in the chart below, which shows composite monthly volatility from January 1990 through last month, using 100 as the series mean.

So…while volatility may indeed trend lower as some of the concerns about the global recession are put to rest in the next few months, lower volatility will have to counter the established seasonal cycle.

For some previous posts on the same subject, try:


[graphic: VIXandMore]

Disclosure: Neutral position in VIX via options at time of writing

Wednesday, December 24, 2008

The VIX Annual Cycle

Two years ago, when I was the only person reading this blog, I posted about VIX seasonal patterns in A Month By Month Look at the VIX. Since the original post I have received quite a few requests to update the chart with more recent data.

On the heels of yesterday’s VIX Holiday Crush, I am pleased to broaden the seasonal picture of the VIX with a current version of 19 years of VIX data as a composite annual cycle. The chart below has changed very little from the January 2007 version. In fact, 2008 followed the historical patterns established in previous years almost perfectly, with the VIX increasing in the January-March period, dropping through May and June, then spiking dramatically in September and October.

I have my doubts about whether this pattern will play out in future years, but the more times volatility wanders down this same seasonal path, the more time traders will be looking for a repeat in the following year.

[source: VIX and More]

Tuesday, December 23, 2008

VIX Holiday Crush

The VIX has been steadily declining during the month of December, from the high 60s on the first day of the month to the neighborhood of 42 as I write this.

Clearly the extraordinary measures taken by the government to pump liquidity into the system have been responsible for some of the shrinking volatility, but since I often talk about the holiday effect on volatility and frequently receive questions on the subject, I thought it would be a good day to share some of my research on the subject.

Since 1990, the month of December has averaged 21.05 trading days. The chart below captures each of those 21 trading days from 1990-2007 in composite form, with the mean for all December VIX values set at 100. In the chart, the pattern of decreasing volatility is most evident from the middle of the month to just before Christmas, during which period volatility drops from 2.4% above the December average (10th trading day) to 4.8% below the December average (17th trading day).

For the record, today is the 17th trading day of December, which makes the the historical low point in volatility for December.

I will not go so far as to say the that calendar suggests today is likely to be the last time the VIX dips under 42 for awhile, but those with an interest in historical context may wish to prepare for an increase in volatility, as the holiday ‘calendar reversion’ effect wears off.

[source: VIX and More]

Thursday, May 15, 2008

One Reason Why Volatility May Have Bottomed

The graphic below says it all – and the official beginning of hurricane season is two weeks from Sunday.

Given the supply issues with oil and natural gas, even the threat of a hurricane in the Gulf of Mexico is sure to cause considerable consternation. Of course, with all the global warming, this year’s prediction from the folks at Colorado State University is not particularly soothing:

"Based on our latest forecast, the probability of a major hurricane making landfall along the U.S. coastline is 69 percent compared with the last-century average of 52 percent," said Phil Klotzbach of the Colorado State hurricane forecast team. "We are calling for a very active hurricane season this year, but not as active as the 2004 and 2005 seasons."

I’ll have more to say on weather and volatility as we get deeper into the hurricane season.

Tuesday, January 8, 2008

The Fallacy of the Bearish First Five Days

I will be the first to admit that one of my favorite trading books to browse through is the Stock Trader’s Almanac, complied by Jeffrey Hirsch and Yale Hirsch. The current version of this annual classic, Stock Trader’s Almanac 2008, has already been sitting on my desk for three months.

I mention this book because the authors have been instrumental in widely disseminating the idea of the ‘January Baromenter,’ which posits that “as goes January, so goes the market.” While the idea of the January Barometer dates back to at least 1972, the corollary, which should be on the mind of many investors today, is that the first five days of January provide an effective ‘early warning system’ about the trend for the balance of the year.

Before I critique these two ideas, let me point out that the data for the general premise of January as a microcosm of a full trading year is compelling. Using the S&P 500 index, the January Barometer includes only five major errors in the past 58 years; and 31 of the last 36 times the first five days were up, the year ended up as well.

But before you load up on more QID in anticipation of the market being sucked into a black hole, it is important to recognize that the data obscures what happens when the year gets off to a particularly ugly start, as it has in the first four trading days of year (through yesterday), where the SPX has been down 3.6%.

As it turns out, since 1950 the SPX has only had a five day start that was worse than 2008 on two occasions: 1978 and 1991. In both cases, however, the year managed to turn around and finish in the green. In 1978, the SPX shook off a -4.7% first five days and was up 6.0% the rest of the year. The turnaround in 1991 was even more dramatic, as anyone who owned NASDAQ stocks (up 56.8% that year) will surely recall. After falling 4.6% the first five days of 1991, the SPX was up 32.5% for the remainder of the year.

If one wants to expand the analysis to the worst full month starts since 1950, the four worst of these starts also turned around by the end of the year as well. In 1970, January was down 7.6%, but the balance of the year was up 8.4%. In 1960, it was -7.1% followed by +4.5%; in 1990 it was -6.9% and +0.3%; and in 1978 it was -6.2%, with a +7.7% turnaround from February through December.

As always, be careful with what you take away from this analysis. Of the 21 Januarys that the SPX has been down, the balance of the year was down 10 times and up 11 times. The bottom line? If there is any message worth remembering from the data above, it is that good starts tend to persist, ugly ones tend to reverse, and slightly down beginnings run the greatest risk of turning into a rout.

Thursday, June 14, 2007

VIX Implosion Ahead?

Let me start off by saying that I would probably mention Adam Warner and his Daily Options Report more often on this blog, but in doing so I risk the possibility of engaging in an extended baseline VIX rally – and that might put everyone to sleep.

In his usually provocative manner, today Adam is talking about the possibility of a VIX implosion that might send the volatility index back into single digits.

I have chronicled the history of sub-10 VIX closes here in the past, but since February 27th, that subject has fallen off of my radar. First, I’ll start with some historical context. Adam mentions the possibility of the VIX imploding during the next options cycle. At current levels, a one month drop of about 30% would be needed to take us into single digits. While a VIX drop of 30% in one month is not unprecedented, the one month in which it happened, April 1994, came on the heels of 40% and 38% monthly gains in the VIX in the previous two months. Then it was a mean-reverting move; this time it won’t be.

Another factor that argues against a large VIX drop is VIX seasonality. As I have previously discussed, the VIX has a tendency to bottom out in June, before spiking dramatically in July, August and September.

Finally, it is always interesting to look at the implied volatility of VIX options. While these have dubious predictive value (see the lack of advance warning for February 27th in the preceding link, which mirrored the complacency prior to the May 2006 selloff,) it is worth noting that VIX IV is sitting just above the 52 week low.

In sum, while I think Adam’s VIX implosion scenario is highly unlikely, I’ll refrain from saying that it cannot happen. I applaud Adam for going out on a limb and being provocative, but with my VWSI looking out 10-20 days, I see the most likely scenario as the VIX continuing in a range of about 12.50 – 15.00 for the next options cycle. Not an exciting prediction, to be sure, but one which will provide me with an opportunity to harvest some theta.

Sunday, March 25, 2007

Complacency Creeping Back In; VWSI at +1

Quite a few commentators, including Tim Knight, have pointed out that the VIX has reversed all of the post 2/27 spike. While volatility measures are subsiding much more rapidly than put to call ratios, it is safe to say that some investors are thinking that the brief correction has passed and the bull market can now safely resume its course. In short, some complacency is creeping back into the market, albeit slowly.

The VIX Weekly Sentiment Indicator (VWSI) reflects some of this complacency, as it has hugged the 0 mark the past few weeks, currently sitting at +1.

While the VWSI generally seeks to predict VIX movements looking out only 1-2 weeks, this is as good a time as any to remind the reader that longer term seasonal cycles are at work as well. You may never have heard, “Sell in March and go away,” but the March-June period marks the downside cycle of the mid-year “V” pattern in the VIX that I have commented on earlier.

I would not be looking to anticipate volatility spikes at this stage, but I would expect that we will see a few more smaller ones in the coming weeks. Better yet, be prepared to play a little Whac-a-Mole and fade these spikes as they occur.

(Note that in the above temperature gauge, the "bullish" and "bearish" labels apply to the VIX, not to the broader markets, which are usually negatively correlated with the VIX.)


Wine pairing: A while back, a reader had the temerity to suggest that I might want to consider offering a wine pairing with the VWSI. Why not? I've been neglecting my wine blog, so why not jump start the latent oenophile in all of us. For the current +1 reading, coming off of some violent volatility spikes and ushering in the new season, I am recommend a dry gewurztraminer. Gewurztraminer is a wine that can stand up to all seasons and all levels of volaltility. It has more personality than any other white wine, is found in more styles and...it's not chardonnay. While the classic version comes from Alsace, I am a big fan of several American versions of this wine: dry; off-dry; and the dessert variety. One winery that gets all three versions right is Navarro. Last weekend, however, I found a stunning example of dry gewurz off the beaten track in the Russian River Valley at Harvest Moon. I hesitate to mention Harvest Moon because it is such a small winery, but the wines are so good that they deserve a wider audience. Enjoy!

Thursday, February 1, 2007

VIX and the Quarterly Cycle

I feel a little like a Ginsu knife, having sliced and diced the VIX: around options expiration; around Fed Days; and even from a monthly seasonal perspective.

When I looked at the earnings season movement in the VIX, I hypothesized that proximity to peak earnings season mattered much more than any influences of the options expiration cycle. I thought a relatively simple test of that theory might be to break down each quarterly cycle into 13 weeks and look at volatility over that 13 week period, keeping in mind that earnings reports for S&P 500 companies generally peak in the fourth and fifth week of each quarterly cycle, with the largest concentration of smaller caps reporting in the fifth week as well.

It turns out that a normalized chart of the 13 week quarterly cycle does not show much of a spike in the VIX leading up to earnings, nor does it show volatility subsiding in the back end of the quarter:


For now, we will leave it to the reader to draw their own conclusions, while we pick up the Ginsu and ponder other ways in which we might wish to julienne the VIX through space and time...

Wednesday, January 31, 2007

A Month By Month Look at the VIX

I’ll cut to the chase and put the graph of the monthly closes (with all values normalized to a monthly mean of 100) in the VIX first:

Since the picture tells almost the whole story, I’ll add only a few supplemental comments:

  • We are currently in the middle of the November-March doldrums
  • March-June and June-September are the two monthly volatility trends to keep an eye on
  • From a “sell in May and go away” perspective, the May-August period has included the VIX high month only twice, but the low VIX month ten out of seventeen years

Friday, January 19, 2007

Volatility: Options Expiration Cycle vs. Earnings Season

For those who wonder why VIX options prices sometimes seem to bear little resemblance to movements in the VIX, Brian Overby at TradeKing has a good article, Decoding the VIX II, that explains how VIX options prices are a function of VIX futures prices, not the underlying VIX prices. (FYI, you can find the first half of Decoding the VIX here.)

Overby discusses some of the implications of this pricing phenomenon and concludes:
"This means that the relationship between the actual VIX index and the VIX options “based” on that index are little hard to follow."
While am quick to nod my head in agreement at this, his metaphor about predicting the weather four months in advance based on current data hits closer to home.
"In simple terms, trading VIX options is like trying to trade options on the temperature at some future date. If, for some odd reason, the temperature in south Florida reaches 120 degrees on October 5, that does not help someone to predict the temperature on February 5 of next year. Perhaps, if there a string of 120-degree days, then, maybe, there could be a trend that might presage a warmer winter and a higher than normal temperature on February. Under normal conditions, however, what happens to the temperature on one particular day in September bears very little relationship to what weather will be in February."
More on what this means to come, but the thoughts here might help those trying to understand some of the many idiosyncracies of the elusive VIX.

On another front, Clare White at Optionetics.com recently authored CSCO IV Seasonality, which discusses the seasonal implied volatility cycles associated with CSCO and earnings releases. Not surprisingly, graphs of CSCO IV show that IV ramps up in the weeks leading up to earnings and spikes for several days before before earnings, only to subside dramatically after the announcement.
CSCO 2006 implied volatility

The implications, of course, are much broader than CSCO and include the VIX. Since the VIX is looking ahead to volatility over the next 30 days, it is important to know when the S&P500 heavyweights are scheduled to report.

For 2007, I have looked at the reporting dates, by week, for the S&P500 and come up with the following table to identify the number of companies that report each week and in each four week cycle:

Week Current Week Current + 3 Weeks
Week 1 2007 2 166
Week 2 2007 (-1) 4 262
Week 3 2007 (opt exp) 45 307
Week 4 2007 (+1) 115 282
Week 5 2007 98 202
Week 6 2007 49 104
Week 7 2007 20 55

Note that the week after options expirations week is at the peak of the earnings reporting season, with the most companies reporting (115), while the weeks before, during and after options expiration have a roughly equivalent number of companies in the SPX reporting during the four week window that roughly coincides with the VIX futures calculation horizon.

With these two thoughts reverberating in my head, I went back to the VIX Performance During the Options Expiration Cycle post, separated out the prime earnings reporting months (January, April, July and October) and compared them with the other eight non-earnings months. I did this for the week after expiration, which happened to show the highest volatility in my previous analysis. Sure enough, the earnings months were 50% more likely than non-earnings months to show VIX moves to the upside of 10% or 15% and more than twice as likely to show moves of 20% or more.

While the data still support the week after options expiration as the biggest volatility week, it turns out that in non-earnings months, the week after options expiration is no more volatile than average. The bottom line is that, as far as I can tell, it is the proximity to earnings releases that makes the week after options expiration more volatile than other weeks. Perhaps more importantly, in terms of the influence on volatility, earnings season trumps the options expiration cycle by a large margin.

DISCLAIMER: "VIX®" is a trademark of Chicago Board Options Exchange, Incorporated. Chicago Board Options Exchange, Incorporated is not affiliated with this website or this website's owner's or operators. CBOE assumes no responsibility for the accuracy or completeness or any other aspect of any content posted on this website by its operator or any third party. All content on this site is provided for informational and entertainment purposes only and is not intended as advice to buy or sell any securities. Stocks are difficult to trade; options are even harder. When it comes to VIX derivatives, don't fall into the trap of thinking that just because you can ride a horse, you can ride an alligator. Please do your own homework and accept full responsibility for any investment decisions you make. No content on this site can be used for commercial purposes without the prior written permission of the author. Copyright © 2007-2023 Bill Luby. All rights reserved.
 
Web Analytics