Showing posts with label VIX bottom. Show all posts

Monday, July 2, 2012

Chart of the Week: VIX Reversal Signal Coming Soon?

Sometimes the simplest ways to analyze the VIX are the best.

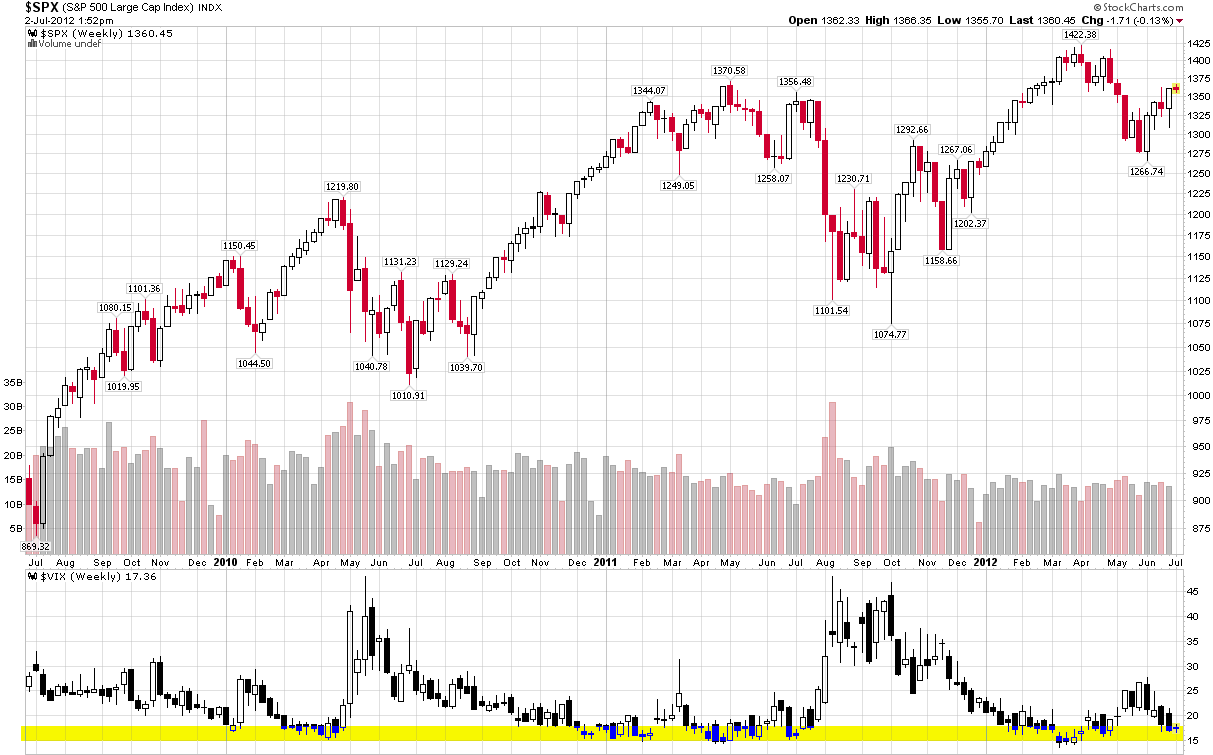
The chart of the week below shows weekly bars of the S&P 500 index and the VIX going back three years. In the VIX study at the bottom, I have also highlighted in yellow the zone from 15-18, which has proven to be a fairly robust zone of support for the VIX during this period. Note that while the VIX has slipped below 15 on occasion, it has eventually bounced off of this support level in each instance and, perhaps more notably, a VIX bottom in the 15-18 range has also coincided with a top in the SPX each time around.

With the VIX in the low 17s as I type this, bulls and bears alike should be on the lookout for signs of a bottom forming in the VIX – and be prepared to position their portfolios accordingly.

Related posts:

[source(s): StockCharts.com]

Disclosure(s): none

Wednesday, July 1, 2009

Timing of VIX Bottom

Based on a number of factors, including my recent comments in VIX at Seasonal Cycle Low, I believe there is a very good chance the VIX may put in an intermediate-term bottom either today or tomorrow.

Friday, October 5, 2007

Where Will the VIX Find a Bottom?

Let me start out by stating for the record that I have no idea whether it is appropriate to use traditional charting and other technical analysis techniques to attempt to determine support and resistance levels for the VIX. After all, the VIX is a multi-generational derivative that is a good distance removed from reality. For purposes of simplification, think of the VIX as a shadow puppet (more accurately, the composite shadow puppet from 500 simultaneous light sources); if we want to learn more about it, should we study the shadows or consider the hands from which the shadows are cast? I have a tendency to talk about the shadows, but for charting purposes I am inclined to believe that they are still just shadows.

So…with that backhanded disclaimer out of the way, let me turn my attention to a VIX that just made an intra-day low of 16.63. Whether that number sounds high or low depends upon where you have been anchoring a ‘normal’ price in your mind. At 16.63, the VIX is 68% above the year’s low (9.87), 56% below the year’s high (37.50), and about 7% above the VIX’s lifetime mean, which stands at 18.93.

I recently made a guesstimate that the VIX would bottom in the 16-17 range in October and I have no reason to depart from that thinking. I will, however, offer the weekly chart of the VIX below as one way to think about that 16-17 support range. Instead of the long-term moving averages (which may look interesting, but are of dubious value), focus instead on the Williams %R number. When the %R crosses below -80, it has a tendency to signal a bottoming out in the VIX – to the extent that you can tell when a shadow puppet is bottoming out…

Wednesday, September 26, 2007

VIX Oversold

At 17.48, the VIX is now 17% below its 10 day SMA and 24% below its 20 day SMA, levels not seen since the end of June 2006. While I am not going to predict that the VIX will jump 43% over the next ten days like it did the last time it was this far below the two SMAs, history suggests that the VIX will start moving up from here and that the broader indices, some of which are approaching previous highs, are due for a selloff.

For the record, the chart below show the VIX with respect to its 10 day simple moving average, with the dotted green lines tracking +10% and -10% from that SMA and the solid green lines indicating the +20% and -20% levels from the 10 day SMA. As a general rule, mean reversion is increasingly likely the farther the VIX strays from the 10 day SMA.

I am inclined to think that the new floor in the VIX for the next month or so will be in the 16-17 range, but that is no more than a guesstimate. How the various sentiment indicators act as we test old highs will tell us a lot about the strength of this decidedly long in the tooth bull. Better not to anticipate, but to prepare for several different contingencies – and keep an eye on the VIX for some clues.

Also, apropos of yesterday's commentary, while the DJIA may be +80 at the moment, I note that many of the recent momentum stocks are in the red: BIDU, GRMN, LVS, BCSI, FWLT, MA, FSLR, AAPL, FCX, PCU, CMI, etc. Keep an eye on this development too.

DISCLAIMER: "VIX®" is a trademark of Chicago Board Options Exchange, Incorporated. Chicago Board Options Exchange, Incorporated is not affiliated with this website or this website's owner's or operators. CBOE assumes no responsibility for the accuracy or completeness or any other aspect of any content posted on this website by its operator or any third party. All content on this site is provided for informational and entertainment purposes only and is not intended as advice to buy or sell any securities. Stocks are difficult to trade; options are even harder. When it comes to VIX derivatives, don't fall into the trap of thinking that just because you can ride a horse, you can ride an alligator. Please do your own homework and accept full responsibility for any investment decisions you make. No content on this site can be used for commercial purposes without the prior written permission of the author. Copyright © 2007-2023 Bill Luby. All rights reserved.
 
Web Analytics