VXN Reversal Signal
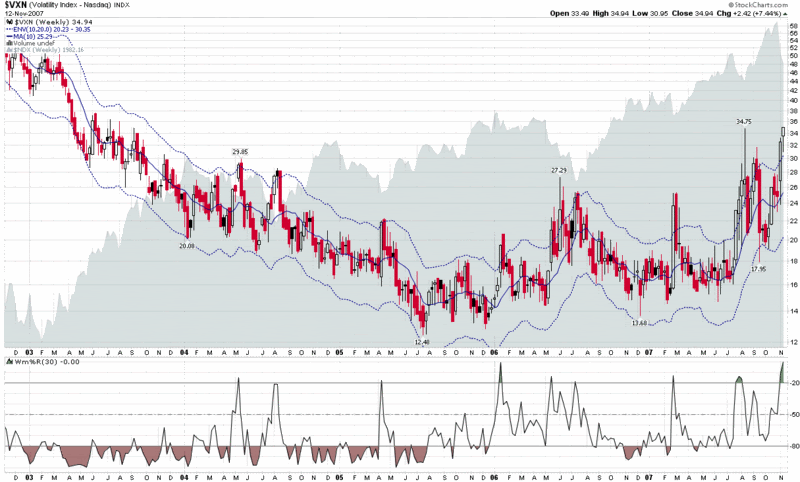
The attached chart shows the VXN (volatility index for the NASDAQ-100 or NDX) over the past five years, with a 10 day simple moving average, flanked by dotted lines representing 20% above and below the 10 day SMA.
Anybody who has been paying attention knows that the last several days have been highly unusual. As the chart shows, the VXN, which rarely closes outside of those 20% bands, is currently 38.2% above the 10 day SMA. This is about as extreme as it gets for volatility outliers and suggests a high probability of a sharp reversion to the mean in the VXN, coincident with a bounce back in the NDX.
For the record, the same market bottom signal is coming from the VIX and SPX, but without the extreme reading that is characterized by the VXN and NDX. By contrast, the signal from the RXV and RUT is substantially weaker and only marginally tradeable.
Volatility signals with this level of confidence are extremely rare, so if you are looking for an excuse to get long in a big way for the short term, or to trade VIX along the lines recently suggested by Brian Overby, today is an excellent opportunity to try to time the markets.


8 comments:
http://billrempel.com/2007/11/11/timing/
Once again, we're both on the same page at just about the same time.
Excellent post. Thanks for the link, Bill. Also, I like the design of the new site (and will change my blogroll to redirect readers there.)
The question, of course, is how long we will continue to see green in the tech names. I am still skeptical that this bounce has legs, but I'm primarily a jellyfish and only secondarily a skeptic...
Cheers,
-Bill
What do you make of the VIX futures (do you follow or trade them) and how about the new VXV over at CBOE?
What kind of use can you see out of the new VXV relative to the existing VIX?
Thanks,
dowoper8tr
Good call!
Good signal, Bill!
$VXN seems to be in process of forming double bottom or am i wrong?
Anon,
An Aug-Nov double top would certainly be what I am expecting at this point.
On the other hand, I don't think double tops are necessarily as strong of a TA signal for volatility indicies as they are for individual stocks.
Cheers,
-Bill
Thank you so much for the post you do. I like your post and all you share with us is up to date and quite informative, i would like to bookmark the page so i can come here again to read you, as you have done a wonderful job.pay as you go cards
Post a Comment