VIX Oversold
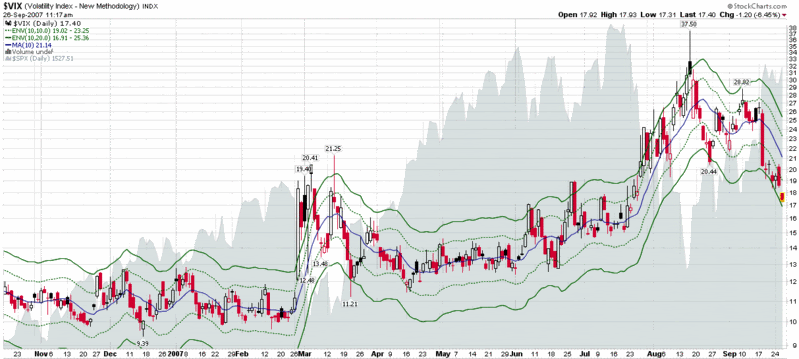
At 17.48, the VIX is now 17% below its 10 day SMA and 24% below its 20 day SMA, levels not seen since the end of June 2006. While I am not going to predict that the VIX will jump 43% over the next ten days like it did the last time it was this far below the two SMAs, history suggests that the VIX will start moving up from here and that the broader indices, some of which are approaching previous highs, are due for a selloff.
For the record, the chart below show the VIX with respect to its 10 day simple moving average, with the dotted green lines tracking +10% and -10% from that SMA and the solid green lines indicating the +20% and -20% levels from the 10 day SMA. As a general rule, mean reversion is increasingly likely the farther the VIX strays from the 10 day SMA.
I am inclined to think that the new floor in the VIX for the next month or so will be in the 16-17 range, but that is no more than a guesstimate. How the various sentiment indicators act as we test old highs will tell us a lot about the strength of this decidedly long in the tooth bull. Better not to anticipate, but to prepare for several different contingencies – and keep an eye on the VIX for some clues.
Also, apropos of yesterday's commentary, while the DJIA may be +80 at the moment, I note that many of the recent momentum stocks are in the red: BIDU, GRMN, LVS, BCSI, FWLT, MA, FSLR, AAPL, FCX, PCU, CMI, etc. Keep an eye on this development too.