Showing posts with label market timing. Show all posts

Thursday, September 18, 2008

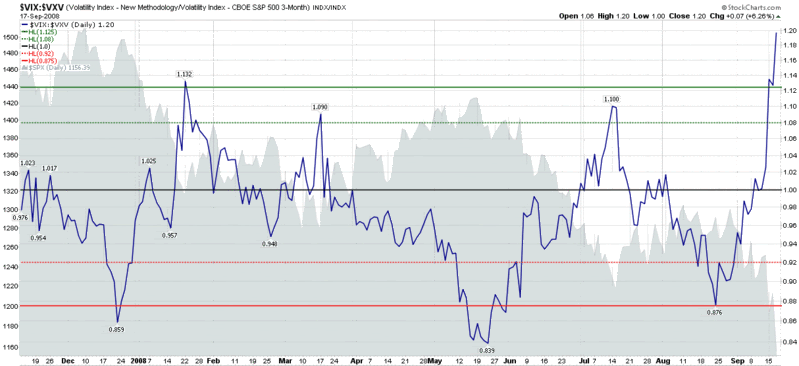
VIX:VXV Ratio at New End of Day High

As far as I know, I was the first person to show interest in the VXV as a market timing indicator and the first to talk about the VIX:VXV ratio when I posted on these subjects back in early December in The VIX:VXV Ratio.

Fast forward nine months and the VIX:VXV ratio has an admirable market timing record and a very strong following, here and elsewhere. Last night it set a new end of day high when the ratio closed at 1.20. So far, readings of 1.08 and above have been good long entry points. Using the same logic, a long entry at 1.20 should be an even better trade. I will be interested to see how last night’s signal turns out.


[source: StockCharts, VIX and More]

Monday, July 21, 2008

Time for Reader Input: Does the VIX Have Market Timing Value?

I am going to try something different today: I’ll frame an issue in the context of an article from a highly regarded pundit, skip my own commentary, and ask for readers to weigh in with their thoughts. We’ll see how this works, if it works at all…

First, a quick summary of the pundit and the issue. Mark Hulbert, who I happen to think highly of, is out today with an interesting point of view in Putting on the VIX over at MarketWatch. The subtitle, “Commendary: Not necessarily bullish that VIX briefly rose above 30 last week” summarizes Hulbert’s position nicely, but I want to highlight several quotes from the article.

First, let me start with Hulbert’s conclusion:

“Even in those situations in which the VIX does appear to have statistically significant ability to forecast market movements, it turns out that those abilities largely derive from no special insights on the part of the VIX itself, but instead because of the stock market's tendency to rebound after steep corrections.

I owe this latter insight to Samuel Eisenstadt, research director at Value Line, Inc. Eisenstadt several years ago designed an econometric test to see if high VIX readings contain any unusual market-timing information after market declines, above and beyond the already-apparent fact that the market has just fallen. He came away empty-handed. High VIX readings tell us nothing more than we would already know from casually reading the news headlines.

The bottom line? The stock market may indeed continue to rally over the next several weeks. But if it does so, it won't be because the VIX momentarily rose above 30 last week.”

Early on in the article, Hulbert makes the case for the attractiveness of the VIX as follows:

“…consider first how the stock market performed over the subsequent month following a VIX close above 30: On average over the past 18 years, it gained 3.8% (as measured by the Dow Jones Wilshire 5000 index). In contrast, the stock market gained just 0.7% over the subsequent month following VIX closes below 30… Furthermore, similar contrasts existed at the quarter, six-month and 12-month horizons.”

Hulbert then goes on to refute the data for VIX closes above 30:

“…there's no way of knowing how high the VIX will rise when it first crosses the 30 threshold. Sometimes, like last week, the stock market immediately rises when that ceiling is broken, leading in most instances to the VIX falling back below 30. On other occasions, however, the stock market continues declining despite the VIX rising above 30, causing the VIX in most cases to continue rising. The all-time high for the VIX is 45.74.

So even though, other things being equal, higher VIX readings are more bullish than lower ones, there's nothing particularly magical about the 30 level.

To correct for this sleight of hand, I focused on just those occasions in which the VIX initially broke the 30 ceiling, after having been below 30 for at least three months previously. The data now painted an entirely different picture: Following those occasions, the stock market on average performed no better than it did the rest of the time.”

Readers, what do you think? Do you find Hulbert’s arguments convincing? Why or why not? What other important perspective and/or data do you think Hulbert is overlooking here? I would be interested in hearing some reader opinions in the comments below.
Tuesday, July 3, 2007

Using the VIX as a Timing Tool for the SPY

Since I am still playing a little bit of catch-up today, I am going to piggy-back on some third party content for today’s post. Specifically, I want to introduce some ideas from MarketSci.com on how to use the VIX to trade the SPY. In a three part series which I have linked below, MarketSci lays out three systems which use the VIX to time SPY trades. These include a long-term system using a 186 day VIX SMA which Barron’s cited in December 2006 as being developed by Credit-Suisse; an 11 day EMA-SMA VIX crossover system; and an 11 day EMA-SMA system which utilizes both the VIX and the SPY as triggers:

Part 1: Long-term Trading with the VIX – 20% deviations from the 186 day VIX SMA

Part 2: Short-term Trading with the VIX – an 11 day EMA-SMA VIX crossover system

Part 3: Our Spin on Trading with the VIX – a combined 11 day EMA-SMA VIX and SPY system

In many respects, these approaches are the SPY complement to the VIX mean reversion plays that I blog about on a regular basis in this space. Of course, unlike the VIX, trading the SPY has the benefit of being able to go long or short the ETF, use 2x leverage long with the SSO or short with the SDS, and use options on the underlying.

So far I have shied away from discussing the VIX as a market timing tool, but as I have increasingly become convinced of its applicability in this area, expect to hear more from me on this in the future.

DISCLAIMER: "VIX®" is a trademark of Chicago Board Options Exchange, Incorporated. Chicago Board Options Exchange, Incorporated is not affiliated with this website or this website's owner's or operators. CBOE assumes no responsibility for the accuracy or completeness or any other aspect of any content posted on this website by its operator or any third party. All content on this site is provided for informational and entertainment purposes only and is not intended as advice to buy or sell any securities. Stocks are difficult to trade; options are even harder. When it comes to VIX derivatives, don't fall into the trap of thinking that just because you can ride a horse, you can ride an alligator. Please do your own homework and accept full responsibility for any investment decisions you make. No content on this site can be used for commercial purposes without the prior written permission of the author. Copyright © 2007-2023 Bill Luby. All rights reserved.
 
Web Analytics