Showing posts with label EWQ. Show all posts

Thursday, June 28, 2012

The Evolution of European Equity Risk

There are many ways in which investors can evaluate risk related to the euro zone. Credit default swaps for sovereign debt are one way to evaluate the risk of country default. Sovereign bond yields are a good proxy for a country’s access to funding via the credit markets. The euro crosses and related directional moves are a barometer of the strength of the currency and the euro zone countries as a whole, while various Intrade contracts can lend a sense of the probabilities that investors assign to various events, such as to the risk of one or more countries dropping the euro.

On the volatility side, the VSTOXX (EURO STOXX 50 Volatility Index) the EVZ (CBOE EuroCurrency Volatility Index) provide a market assessment of risk and uncertainty in euro zone stocks as well as the currency.

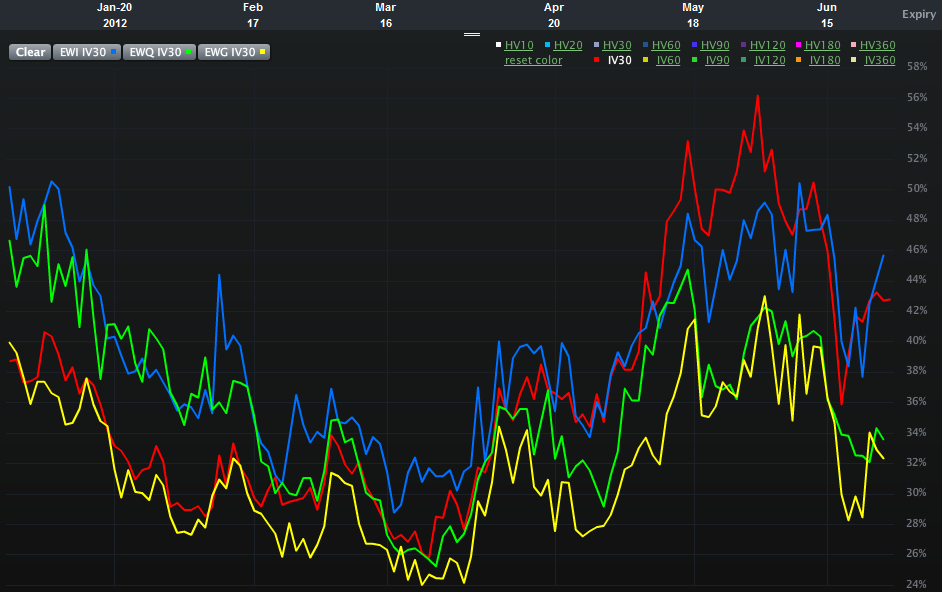
One piece of analysis I have not seen, however, is an assessment of the relative risk and uncertainty for equity markets in some of the more important euro zone nations. Specifically, Spain, Italy, France and Germany. The chart below attempts to offer up that very information, using 30-day implied volatility for the various country ETFs over the course of the past six months:

  • EWP – Spain (red line)
  • EWI – Italy (blue line)
  • EWQ – France (green line)
  • EWG – Germany (yellow line)

Looking at the chart, what initially catches my eye is the recent evolution of the two-tiered risk system. In the first half of the year, the higher risk is clearly associated with Italy and France, whereas Spain and Germany appear to be considerably less risky in terms of implied volatility. By the March the risk appears to have lessened across the board and the distinctions between individual countries is more difficult to discern. Over the course of the last 1 ½ months or so, a new two-tiered system has appeared. This time around it is Italy and Spain where the risk to equities is considered to be the greatest, with France now joining Germany in the lower risk tier.

In essence, Italy has persisted in the high risk tier and Germany has been a constant in the lower risk category. Over the course of the past few months, the interesting development has been the switch between France and Spain, with the former improving from being a peer of Italy to a peer of Germany, while Spain has moved in the opposite direction.

One could certainly argue that all four countries are in the same boat (taking on water, with shoddy life preservers, in shark-infested waters and being one small mutiny away from having no captain…), but clearly investors think there are important distinctions to be made in terms of equity risk and uncertainty. Perhaps of more interest, these fortunes appear to be shifting, with little perceptible difference not just between Spain and Italy, but also between Germany and France.

Related posts:

[source(s): LivevolPro.com]

Disclosure(s): Livevol is an advertiser on VIX and More

Sunday, May 6, 2012

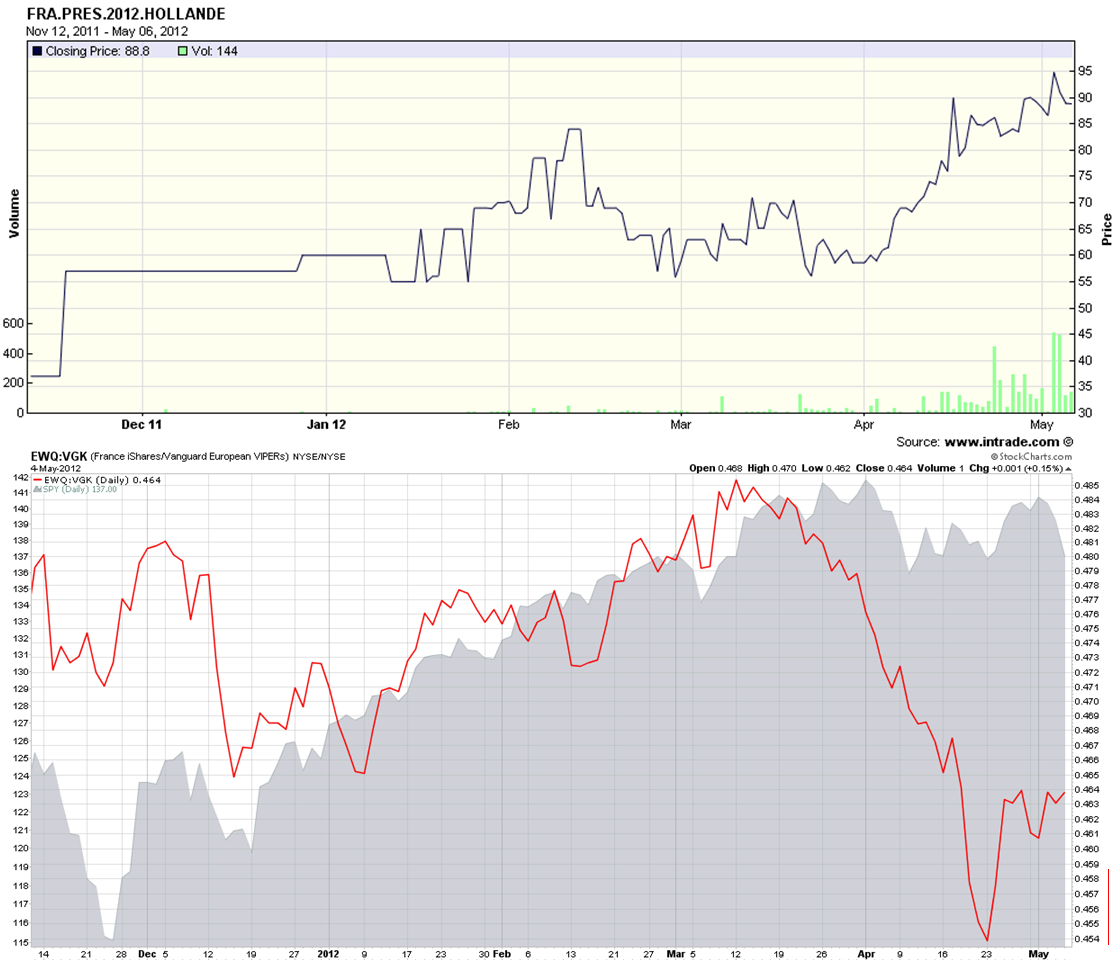
The Hollande Discount

With a little more than an hour to go before the equity markets open in Europe, investors are still attempting to digest the significance of an electoral victory for Francois Hollande in France as well as a much more fragmented political scene in Greece, where the radical leftist Syriza party showed surprising strength.

While the outcome of the election in Greece was very difficult to handicap, the probability of a Hollande victory increased dramatically over the course of the last month or so.

The chart of the week below shows the likelihood of a Hollande victory as indicated by the Intrade election contract (solid black line in upper half of top chart) since the second week of November. At the same time support for Holland was growing, one can see that the expectations for a Hollande victory put pressure on France ETF, (EWQ). The bottom half of the top chart shows a ratio of the EWQ to the broader Europe ETF, VGK as a solid red line. This ratio has declined sharply in conjunction with Hollande’s increasing strength in the polls and has moved in the opposite direction of U.S. stocks (gray area chart) since the middle of March.

For some additional context, I have also included a bottom chart that captures the EWQ:VGK ratio and the SPY going back four years. Note that France was generally a source of relative strength in the euro zone through June 2011 and has struggled relative to its peer group for most of the past year.

Looking at the full set of charts, it is apparent that the markets have been pricing in the likely impact of a Hollande victory for the better part of a month. With U.S. equity futures down approximately 1% as I type this, my sense is that the Hollande discount has almost completely priced in, but the increased uncertainty in Greece is likely to roil the markets and put a jolt into volatility expectations for at least the next few weeks going forward.

Related posts:

[source(s): StockCharts.com, Intrade.com]

Disclosure(s): none

Tuesday, May 11, 2010

Recent Performance Divergence in European ETFs

With all the turmoil in Europe, I thought it would be interesting to check on some of the single country ETFs for those nations which have been closest to the sovereign debt crisis. The chart below, courtesy of ETFreplay.com, captures the year-to-date price movements and (historical) volatility for the likes of Germany, France, Italy and Spain.

Not surprisingly, Germany has held up the best and Spain has been the worst performer in 2010. France, which had been tracking fairly close to Germany, has fallen into second as the country’s bank exposure to Greece has saddled France with additional risk. Italy, which has been on the periphery of the contagion concerns, has fared only slightly better than Spain and has actually been the worst performer of the four during the last month and a half as the crisis has deepened.

Also, note that as is often the case, volatility is negatively correlated with performance in these countries, as the largest moves have been negative ones.

For more on related subjects, readers are encouraged to check out:


[source: ETFreplay.com]

Disclosure(s): long EWG at time of writing

DISCLAIMER: "VIX®" is a trademark of Chicago Board Options Exchange, Incorporated. Chicago Board Options Exchange, Incorporated is not affiliated with this website or this website's owner's or operators. CBOE assumes no responsibility for the accuracy or completeness or any other aspect of any content posted on this website by its operator or any third party. All content on this site is provided for informational and entertainment purposes only and is not intended as advice to buy or sell any securities. Stocks are difficult to trade; options are even harder. When it comes to VIX derivatives, don't fall into the trap of thinking that just because you can ride a horse, you can ride an alligator. Please do your own homework and accept full responsibility for any investment decisions you make. No content on this site can be used for commercial purposes without the prior written permission of the author. Copyright © 2007-2023 Bill Luby. All rights reserved.
 
Web Analytics