Showing posts with label EWP. Show all posts

Friday, July 13, 2012

Rally Leaves Spanish Banks Behind

Stocks are firing on all cylinders today, with the S&P 500 index up more than 1.4% as I type this and most heat maps showing nothing but various shades of green. Even European stocks are strong today. With Europe’s exchanges closed for the weekend, the European country ETFs have followed the U.S. markets higher, though Spain’ ETF (EWP) has been a laggard.

Look at the ADRs for Spain’s banks, however, and it appears that the banks are not participating in today’s rally. Spain’s largest bank, Banco Santander (ticker SAN, previously STD until one month ago today) had managed a gain of just 0.03 today, while the country’s #2 bank, Banco Bilbao Vizcaya Argentaria (BBVA), is off 0.04.

In short, it appears that no matter what the U.S. markets do or the euro zone leaders say or do, stocks for these Spanish banks continue to act as if they are swimming in concrete shoes.

The chart below shows the price action in BBVA since the beginning of 2011, as well as a study on top of the main chart that tracks the performance of BBVA relative to SPY for the same period. In the ratio chart study, I have thrown a 200-day moving average of BBVA:SPY (solid blue line) to underscore that not only has the trend been consistently down, but the ratio has not even come close to trading over its 200-day moving average at any point in the past 1 ½ years.

For the record, the chart for SAN and the SAN:SPY ratio is equally ugly and a similar chart of EWP:SPY is no better than a chart of the Spanish banks.

It remains to be see how the situation with Spain and its banks will be resolved, but until there is some sort of resolution on the horizon, I would to continue to expect to see considerable activity in the puts of SAN and BBVA.

Related posts:

[source(s): StockCharts.com]

Disclosure(s): short SAN and BBVA at time of writing

Saturday, July 7, 2012

Chart of the Week: As Goes Spain…

Two years ago today, in Spain rallies, I posted a chart of the Spanish ETF, EWP, that showed EWP had rallied off of a bottom and looked like it was poised for a bullish breakout.

In July 2010, I saw Spain as the keystone in the euro zone puzzle:

“Spain is the tipping point in the European sovereign debt crisis as I see it. In a nutshell, as goes Spain, so goes Europe.”

Two years later, I still believe that Spain is the most important line in the sand that euro zone leaders have to grapple with and the country whose fate is probably most intertwined with the future of the euro.

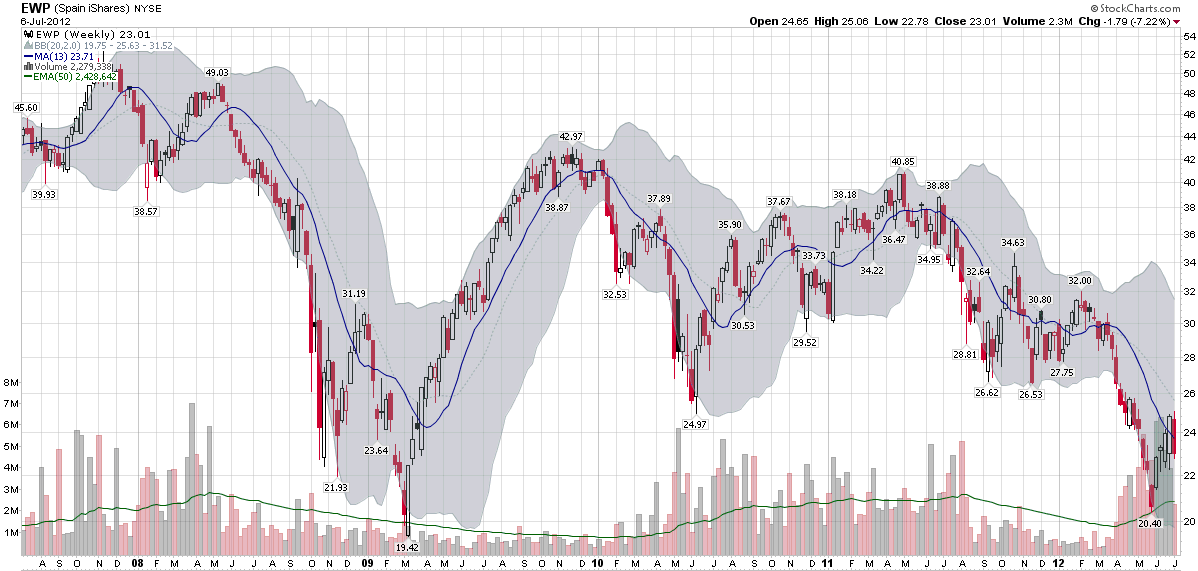
The chart of the week below shows weekly bars of EWP going back five years. The dominant feature in this chart is the financial crisis of 2008-2009. Various iterations of the euro zone crisis can be identified in the bottoms in June 2010, September 2011, November 2011, etc. EWP was in a gradual downtrend from April 2011 to March 2012, but fell sharply until the beginning of June. The most recent bounce in the Spanish ETF still looks somewhat tentative on the charts and is likely to be tested in the weeks and months ahead.

As concerning as the equity situation looks in Spain, the country’s credit default swaps (just 8% off of their all-time highs at 578) and yields on sovereign debt (yields on the 10-year bond are 5% below their all-time highs at 6.95%) indicate an even greater degree of financial stress.

At one time or another, I would expect Italy, France to find their way back into the crosshairs of traders who are looking to capitalize on euro zone angst, but as far as I am concerned, Spain will continue to the most critical line in the sand.

Related posts:

[source(s): StockCharts.com]

Disclosure(s): none

Thursday, June 28, 2012

The Evolution of European Equity Risk

There are many ways in which investors can evaluate risk related to the euro zone. Credit default swaps for sovereign debt are one way to evaluate the risk of country default. Sovereign bond yields are a good proxy for a country’s access to funding via the credit markets. The euro crosses and related directional moves are a barometer of the strength of the currency and the euro zone countries as a whole, while various Intrade contracts can lend a sense of the probabilities that investors assign to various events, such as to the risk of one or more countries dropping the euro.

On the volatility side, the VSTOXX (EURO STOXX 50 Volatility Index) the EVZ (CBOE EuroCurrency Volatility Index) provide a market assessment of risk and uncertainty in euro zone stocks as well as the currency.

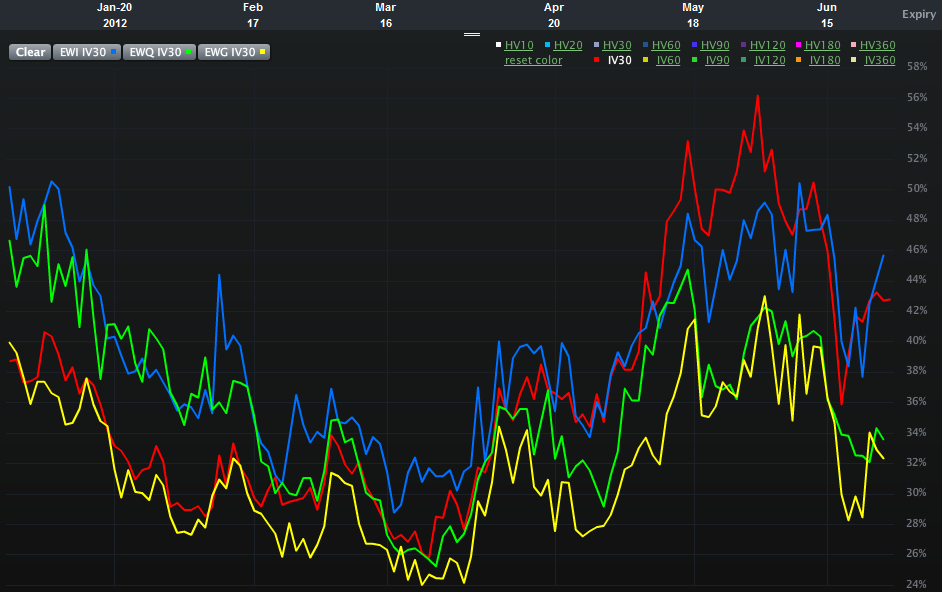
One piece of analysis I have not seen, however, is an assessment of the relative risk and uncertainty for equity markets in some of the more important euro zone nations. Specifically, Spain, Italy, France and Germany. The chart below attempts to offer up that very information, using 30-day implied volatility for the various country ETFs over the course of the past six months:

  • EWP – Spain (red line)
  • EWI – Italy (blue line)
  • EWQ – France (green line)
  • EWG – Germany (yellow line)

Looking at the chart, what initially catches my eye is the recent evolution of the two-tiered risk system. In the first half of the year, the higher risk is clearly associated with Italy and France, whereas Spain and Germany appear to be considerably less risky in terms of implied volatility. By the March the risk appears to have lessened across the board and the distinctions between individual countries is more difficult to discern. Over the course of the last 1 ½ months or so, a new two-tiered system has appeared. This time around it is Italy and Spain where the risk to equities is considered to be the greatest, with France now joining Germany in the lower risk tier.

In essence, Italy has persisted in the high risk tier and Germany has been a constant in the lower risk category. Over the course of the past few months, the interesting development has been the switch between France and Spain, with the former improving from being a peer of Italy to a peer of Germany, while Spain has moved in the opposite direction.

One could certainly argue that all four countries are in the same boat (taking on water, with shoddy life preservers, in shark-infested waters and being one small mutiny away from having no captain…), but clearly investors think there are important distinctions to be made in terms of equity risk and uncertainty. Perhaps of more interest, these fortunes appear to be shifting, with little perceptible difference not just between Spain and Italy, but also between Germany and France.

Related posts:

[source(s): LivevolPro.com]

Disclosure(s): Livevol is an advertiser on VIX and More

Sunday, April 15, 2012

Chart of the Week: Don’t Blame China

Last week’s financial headlines were dominated by Spain and China. In the case of Spain, this was largely due to increased borrowing by Spanish banks from the European Central Bank. For China the culprit was Q1 GDP growth of only 8.1%, which was down from 8.9% in Q4 2011 and well short of the 9.0% whisper number that made the rounds in the day leading up to Friday’s announcement. In fact, once could certainly argue that it was China’s GDP whisper number that was the main catalyst for Thursday’s big rally that was essentially reversed on Friday.

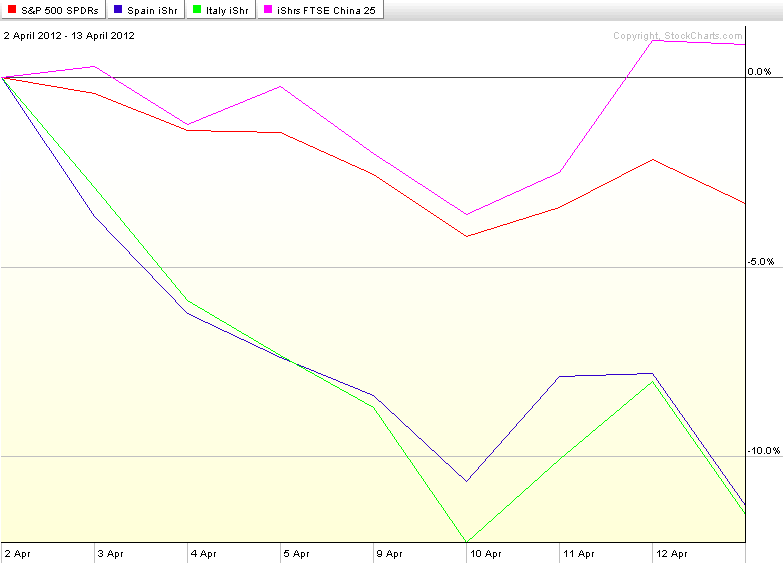
The chart of the week below shows the performance of SPY as well as country ETFs for Spain (EWP), Italy (EWI) and China (FXI) since stocks put in a top two weeks ago tomorrow. The chart shows that while SPY has been declining, country ETFs for Spain and Italy have been falling approximately three times as quickly as their American counterparts. And China? Well, don’t blame China for the woes in the U.S. stock market. While U.S. stocks have been selling off, the performance of the popular iShares FTSE/Xinhua China 25 Index, FXI, has managed to post a 0.9% gain.

[As a side note, about a year ago I discontinued the Chart of the Week, an extremely popular feature in this space since its launch in 2008, as my posting had become sporadic. Going forward I hope to be able to continue my recent regular posting and make this a weekly feature that not only shines a light on key developments of the past week, but also has some archival value as well.]

Related posts:

[source(s): StockCharts.com]

Disclosure(s): none

Friday, April 13, 2012

Banco Santander Finally Tackles One Huge Problem: Its Ticker

With Spain firmly in the crosshairs of Act N+1 of the European sovereign debt crisis, it was with great comfort that I noted yesterday’s announcement from Spain’s largest and most important bank, Banco Santander (STD), that the company was finally addressing what I considered to be a seriously overlooked problem, its ticker symbol. After kicking the can down the road for what must have been countless meetings and conference calls, the marketing and PR people can finally claim a small victory now that Banco Santander has indicated it will change the NYSE ticker symbol of its American Depositary Shares from “STD” to “SAN” effective at the commencement of trading on June 14, 2012.

In the meantime, traders continue to favor STD puts and puts from Spain’s second largest bank, Banco Bilbao Vizcaya Argentaria (BBVA), both of which have a more liquid options market than that of Spain’s ETF, EWP.

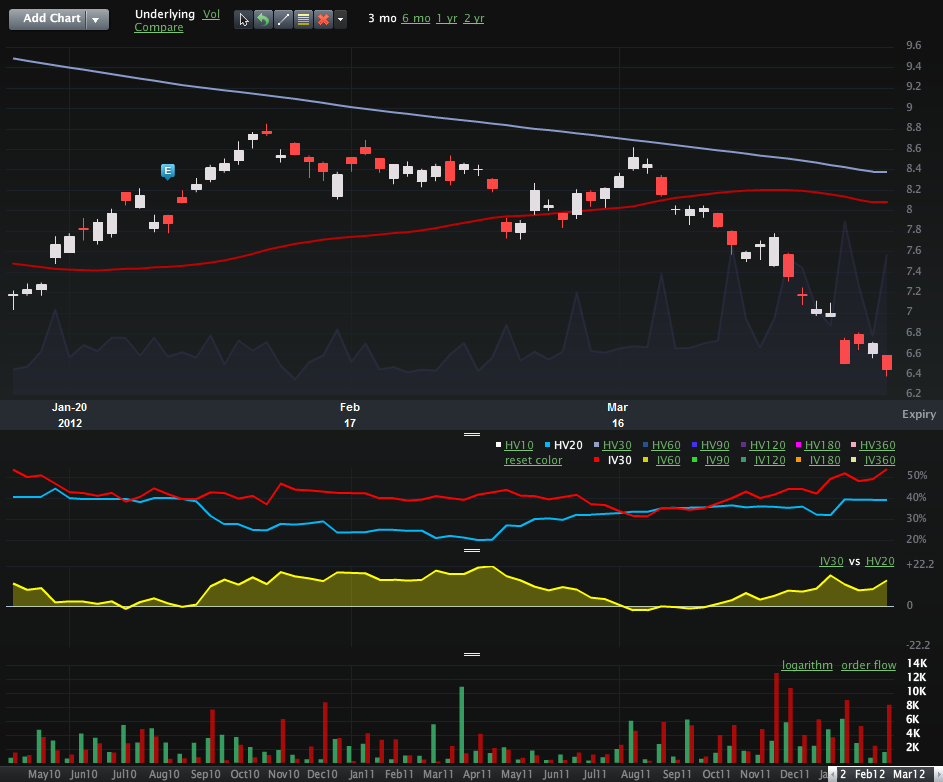
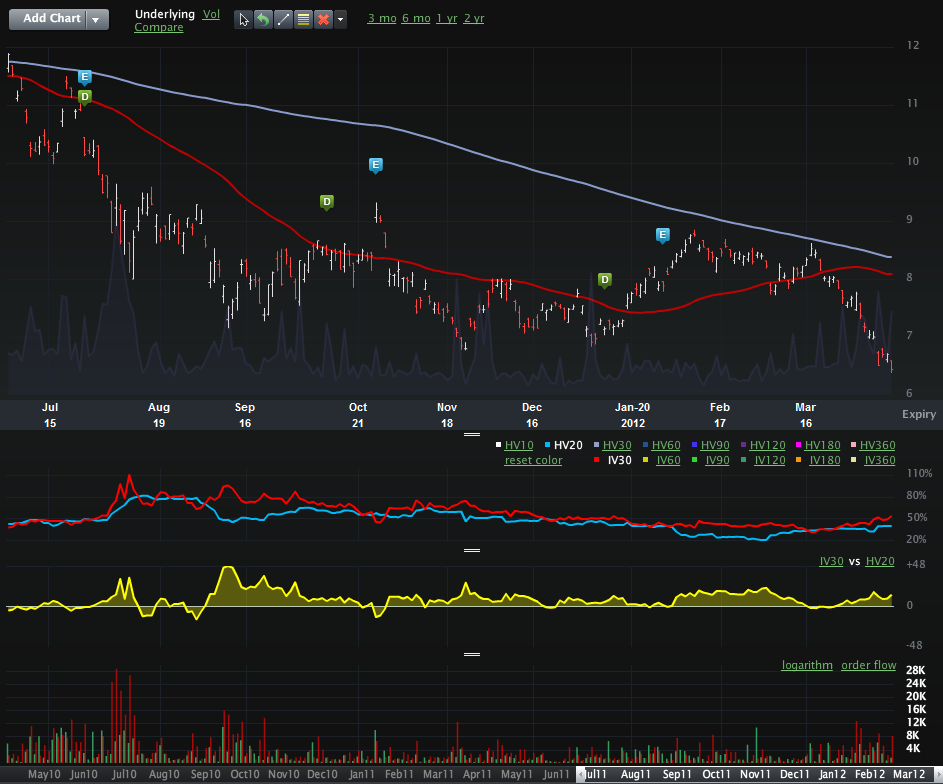
The top chart below shows put activity (red columns in bottom section of graph) ramping up in STD over the course of the last two weeks or so. The lower chart, however, puts recent options activity in the context of the August-October peak in the sovereign debt crisis, with a graphic that dates from July 1, 2011 and shows peak put activity (28.791 contracts per day) and implied volatility (111) dating from the week of August 4 – August 11, 2012.

As far as options traders are concerned, the current situation, while fraught with potential land mines, still pales in comparison to the challenges on the horizon six months ago.

Of course a new ticker won’t help address the underlying problems facing Banco Santander and Spain as a whole, but at least it might cut down on the snickers…

[VIX and More occasionally tilts at humor.  For more on these efforts, check out posts with the “lighter side” label.]

Related posts:

[source(s): LivevolPro.com]

Disclosure(s): short STD and BBVA at time of writing

Friday, March 30, 2012

Why Not Point Hedges?

When most people think of hedges, they think in broad terms like hedging an entire long equity portfolio with SPX/SPY puts or VIX calls or some similar product. The thinking is typically that it is better to have broad-based protection against a bear move in stocks and/or a spike in volatility than to build only one castle wall facing the direction in which an enemy attack is expected. More often than not, it is the unexpected that wreaks havoc on a portfolio, not the white swan that slowly morphs into ivory, then light gray, then…

I might as well say this up front: I hate hedges. I love the idea of hedges, but when it comes time to pay for one, they invariably come across as more expensive than even a reasonably effective market timing strategy. Of course, there are all kinds of hedges, from those that are limited to disaster protection insurance to those that are intended to counteract even the slightest nick to a portfolio. If I feel like I can get my hedges at a discount (Groupon, are you listening?) then I will gladly ante up and enjoy the safety net.

Now there are some out there who think that some of the risks to stocks, particularly domestic equities, are being exaggerated by most investors. Those who hold this opinion might be better served to avoid a broad-based hedge and think in terms of what I call a point hedge. Simply stated, a point hedge is a rifle approach to portfolio protection rather than a (full perimeter) castle wall approach.

Perhaps an example will help to illustrate the point hedge approach. Let’s assume that an investor thinks that the U.S. economy will do better than the doomsayers predict and even fulfill James Altucher’s prediction, which was far-fetched at the time, that the SPX will hit 1500 in relatively short order. If that’s the case, then should the rifle be aimed? Let’s further assume that this bullish investor is primarily concerned about a worsening conflict between Iran and Israel, Spanish fiscal issues starting to resemble the Greek crisis, a possible hard landing in China and the rise of cyberwarfare.

Rather than construct a broad-based hedge, it is possible to create a more cost-effective portfolio hedge by aggregating point hedges across all four areas of concern. For Iran and Israel, something like a long position in Brent crude oil (BNO) might do the trick. As far as Spain is concerned, purchases of puts in the country ETF (EWP) would be appropriate, but a more liquid and perhaps more targeted approach might be long puts in Spain’s largest bank, Banco Santander (STD). There are many alternative approaches in China, but certainly a short position in FXI or some long puts in that ETF is one approach worth investigating. Last but not least, cyberwarfare presents a different set of problems, but some of the firms where call purchases might be hedges against a spike in cyberwarfare are SAI, CHKP, FIRE, FTNT and SYMC.

Of course this is just one of many potential list of threats to the stock market and possible point hedges that might be used to counteract them. Even if you prefer the blanket coverage of a broad-based hedge, it is usually worth the time and effort to draw up a list of potential threats and stocks/ETPs that might be employed to counteract those threats or perhaps even provide some speculative gains.

On a related note, I realize that I have only periodically been applying the “hedging” label to my posts, so I reviewed quite a few posts in the archives and have begun to retroactively apply that label to those posts (such as several in the list below) which might be of particular interest to financial archeologists.

Related posts:

[graphic: Scaliger Castle, Sirmione, Italy – Library of Congress]

Disclosure(s): long FIRE at time of writing

Wednesday, July 7, 2010

Spain Rallies

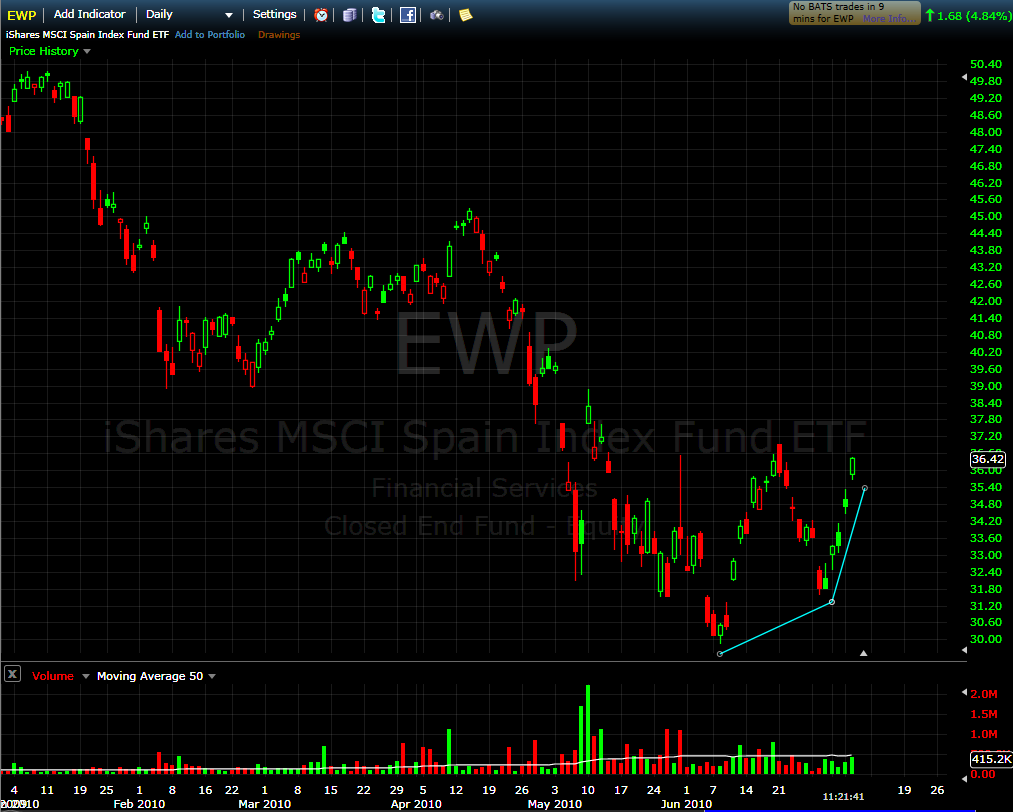
With all the excitement over the performance of Spain’s soccer team in the World Cup, it has been easy to overlook the performance of the Spanish ETF, EWP. From a low of 29.85 almost a month ago, EWP has now rallied 22.1%, even as the country’s credit default swaps have remained elevated.

As the chart below shows, a close above 37 could signal a new breakout and perhaps a significant uptrend.

More importantly, Spain is the tipping point in the European sovereign debt crisis as I see it. In a nutshell, as goes Spain, so goes Europe.

For more on related subjects, readers are encouraged to check out:


[source: FreeStockCharts.com]

Disclosure(s): long EWP at time of writing

Tuesday, May 11, 2010

Recent Performance Divergence in European ETFs

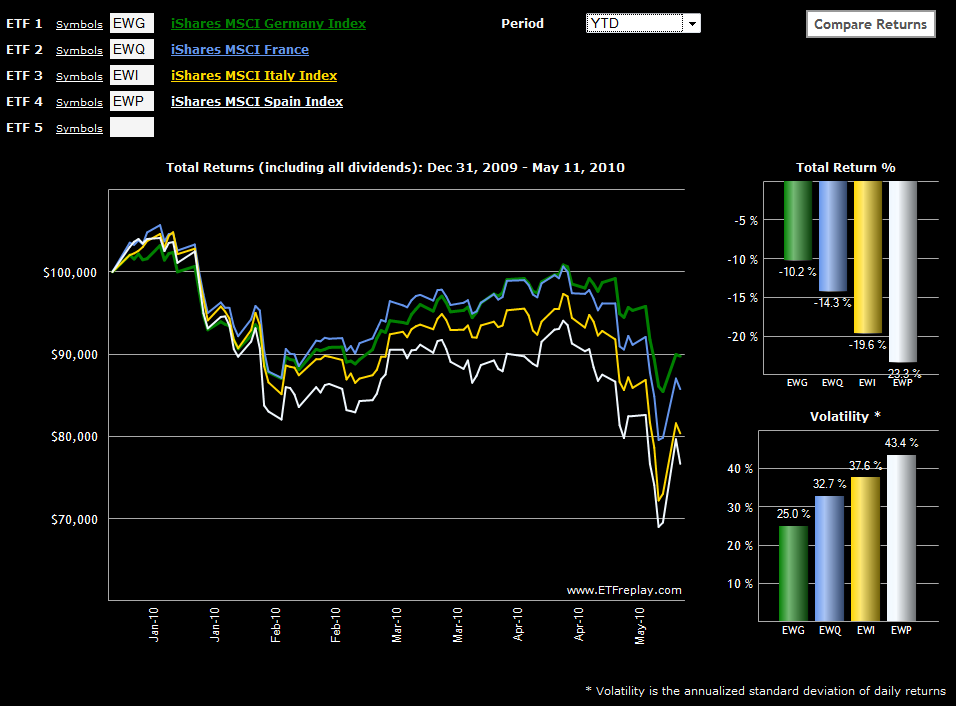
With all the turmoil in Europe, I thought it would be interesting to check on some of the single country ETFs for those nations which have been closest to the sovereign debt crisis. The chart below, courtesy of ETFreplay.com, captures the year-to-date price movements and (historical) volatility for the likes of Germany, France, Italy and Spain.

Not surprisingly, Germany has held up the best and Spain has been the worst performer in 2010. France, which had been tracking fairly close to Germany, has fallen into second as the country’s bank exposure to Greece has saddled France with additional risk. Italy, which has been on the periphery of the contagion concerns, has fared only slightly better than Spain and has actually been the worst performer of the four during the last month and a half as the crisis has deepened.

Also, note that as is often the case, volatility is negatively correlated with performance in these countries, as the largest moves have been negative ones.

For more on related subjects, readers are encouraged to check out:


[source: ETFreplay.com]

Disclosure(s): long EWG at time of writing

Tuesday, February 9, 2010

Are You Watching Greece?

Retail investors in the United States sometimes have difficulty staying on top of events and markets in Europe.

In the last week, I have suggested several ways to monitor the status of various pockets of interest in Europe, including Spain (via the iShares MSCI Spain Index ETF, EWP) and the euro. I certainly also could have included the VSTOXX, the volatility index tied to the Dow Jones STOXX 50 index of European companies.

While I love proxies, ground zero for the European financial crisis is Greece, where ongoing discussions with European Union leaders, particularly those from Germany, are wrestling with the best way to balance national and regional interests.

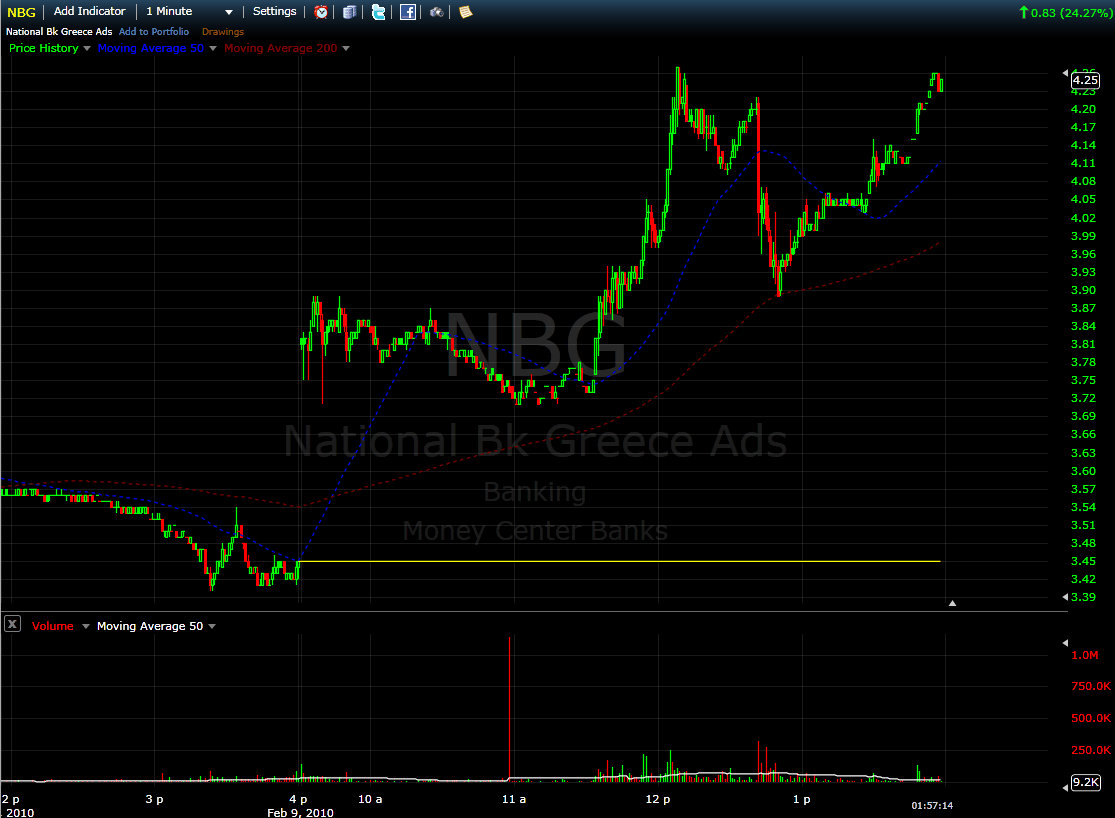
There is not currently a Greek ETF, but as proxies for Greece go, the National Bank of Greece (NBG) is an excellent one. This bank trades millions of shares per day and has a market cap of $12.5 billion. So whether you just wish to take the temperature of the Greek financial situation or want to speculate on a particular outcome, NBG is a worthy addition to any watch list.

For related posts on these subjects, readers are encouraged to check out:


Disclosures: long NBG and EWP at time or writing

[source: FreeStockCharts.com]

Thursday, February 4, 2010

Greece, Spain and the Pulse of European Anxiety

Investors who are attempting to get a sense of the magnitude of anxiety about the economic problems in Greece have a multitude of ways in which to measure how markets are evaluating the situation. Perhaps the most direct approach is with Greece credit default swaps, but the sovereign credit information available to retail investors through firms such as Markit is neither timely or comprehensive.

The euro is another excellent proxy for sentiment about Greece and the rest of the so-called PIIGS (Portugal, Italy, Ireland, Greece and Spain), though once again many U.S. retail investors do not have much in the way of background and experience when it comes to foreign currency.

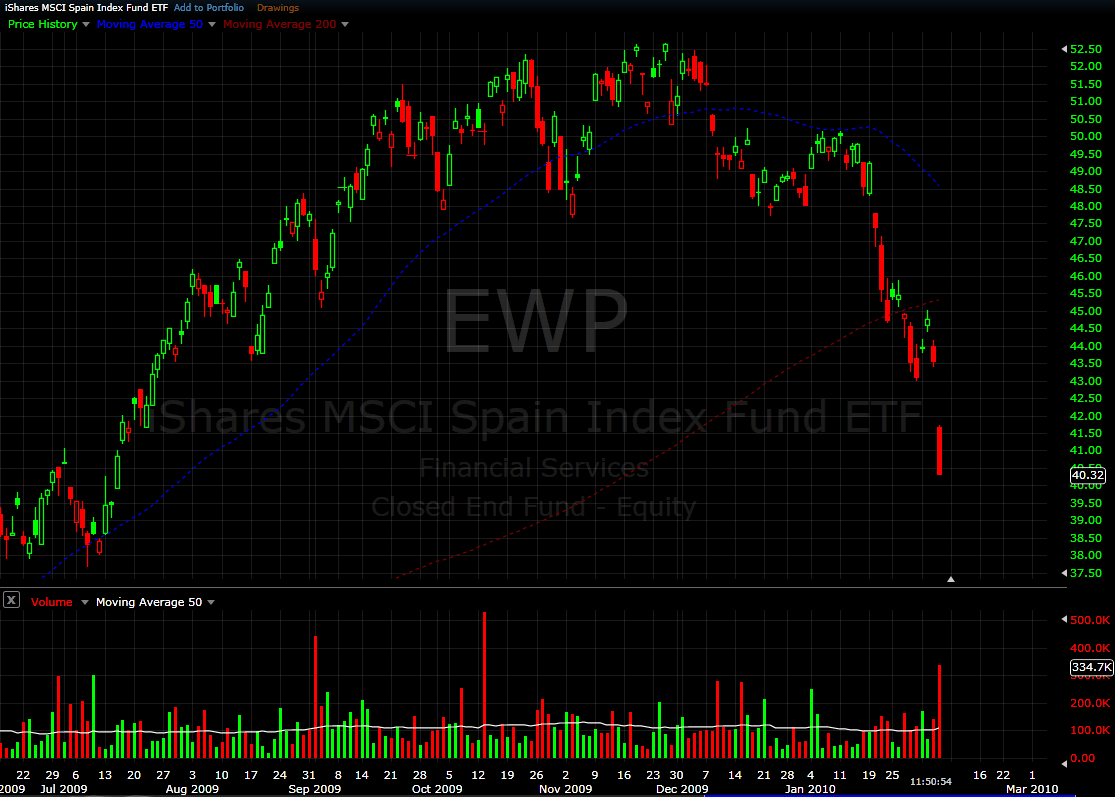
My recommendation is to watch the iShares MSCI Spain Index ETF, EWP. This is a reasonably liquid ETF that is appropriate as a market barometer and/or trading vehicle. The chart below shows the performance of EWP going back to June 2009. After breaking recent technical support at 47.50, this ETF has been subject to intense selling pressure and after a large gap down this morning is currently trading down about 7% on the day.

Watch the euro, watch Spain, watch the large European banks, and if you can get your hands on some good credit default swap data, use a healthy dose of that to take the temperature of the European markets. The situation in Greece is very different than that in Dubai. Whether that is a good or a bad thing remains to be seen.

For related posts on these subjects, readers are encouraged to check out:


[source: FreeStockCharts.com]


Disclosures:
short EWP at time of writing

DISCLAIMER: "VIX®" is a trademark of Chicago Board Options Exchange, Incorporated. Chicago Board Options Exchange, Incorporated is not affiliated with this website or this website's owner's or operators. CBOE assumes no responsibility for the accuracy or completeness or any other aspect of any content posted on this website by its operator or any third party. All content on this site is provided for informational and entertainment purposes only and is not intended as advice to buy or sell any securities. Stocks are difficult to trade; options are even harder. When it comes to VIX derivatives, don't fall into the trap of thinking that just because you can ride a horse, you can ride an alligator. Please do your own homework and accept full responsibility for any investment decisions you make. No content on this site can be used for commercial purposes without the prior written permission of the author. Copyright © 2007-2023 Bill Luby. All rights reserved.
 
Web Analytics