China About to Break Out?
It was only ten days ago that I thought I would be provocative with an early call on China in Time to Be Long China? Since that time, what looked like a possible cessation in downside momentum has turned decidedly more bullish, with the FXI rising an additional 10%.
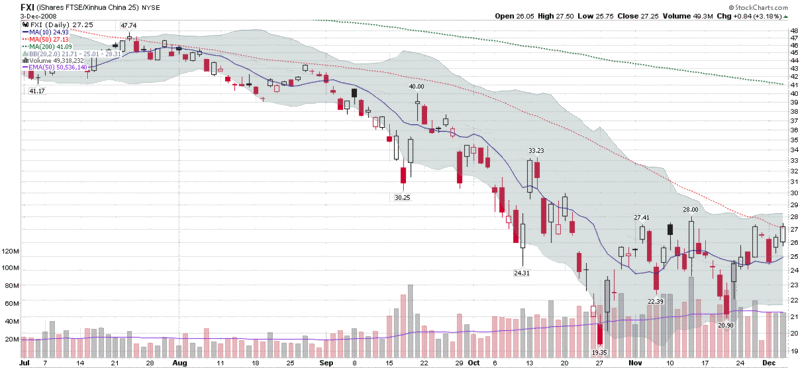
The chart below shows FXI, the iShares FTSE/Xinhua China 25 Index ETF, closing above its 50 day simple moving average (SMA) for the first time in 4 ½ months yesterday. It has been 27 trading days since the FXI put in a bottom. Since that time, the Chinese ETF has rallied more than 40% off of that bottom.
If FXI can close above its 50 day moving average again today, it will mark the first time in over six months that FXI has closed above that important technical level on consecutive days. Ten minutes into today’s session, FXI is trading at 26.70, down 0.55. With the 50 day SMA at 26.94, any close at 27.00 or above should leave a fairly bullish signal on the chart and support the case for increasing upside momentum.

[source: StockCharts]


11 comments:
This chart seems to draw a double bottom (W shape) and so do most of the international indices.
From a purely graphical point of view, the bullish bias would only be confirmed if the underlying ETF closes above the 'neckline' (here 28). Interestingly, as we approach the necklines on these indices, the VIX gets closer to the 60 level which it recently jumped off of.
(Please excuse my English)
Good points, PAT -- as good as your English :)
I agree that the 28 level is ultimately more important than the 27 level. My thinking, however, is that if the FXI closes above the 50 day SMA for several days in a row, the 28 becomes much more likely to fall. You are right though: if 27 falls but 28 holds as resistance, the bulls have done nothing more than bought themselves a little time.
Cheers,
-Bill
P.S. As an aside, I wish my French were good enough to read your blog. It looks like you have a lot of interesting material there.
I'm with Pat on this one - I've got a buy on it at $27.98 to be very specific. :)
one more short term pullback for the global stock market and then we will break out higher in the coming weeks.
Jimmy
Bill,
I cannot find your contact info. Would like to get some of your thoughts for an upcoming column.
Michael Kahn
Barrons Online
mkahnmkahn@yahoo.com
Hey guys,
Thanks for your reply Bill. Thanks also for your kind comment about my blog. Actually, it appears I don't write any more because it takes really too much time. And time is the kind of commodity you can't buy on the CME, unfortunately.
About the 27-28 level debates, what disturbs me is that I don't think 50 days SMA or any MA provides enough statistically significant support/resistance areas. Let me make myself clear: it doesn't seem to me that professionnals - and more generally people who make the market - use it as a signal. The recent tops (like the 28 level) or bottoms certainly tend to have more impact for two reasons. First, from a technical point of view, a top isn't a top for nothing: someone out there sold when the share got to that level. Second, from a psychological point of view: keeping things simple, recent tops are naturally important levels because the market failed on breaking this resistance so on the second attempt, you ask yourself one thing: "When was the current level last reached?"
That being said, we absolutely agree: if the 27 level is broken, 28 won't be far then.
I am very partial..actually long CAF..chart looks cleaner to me. It's a closed end fund but has no leverage to worry about.
Bill, what do you think of today's VIX close? Do you think it's bearish or bullish for VIX?
Thanks! As always, appreciate your expertise on VIX!
Anon,
A little know secret is that I have developed a VIX prediction program that I think I am going to roll out in the subscriber newsletter starting at the beginning of next year.
Just for grins, the program predicts a VIX of 64.10 at tomorrow's close and a VIX of 61.78 a week from now.
With all due respect to the program, I think just getting the employment data out of the way will probably put a reasonable dent in volatility, but that depends on just how bad the numbers turn out to me. If I could predict the employment data I could offer a better sense of the VIX, but I do think there is a much higher likelihood that we see a VIX in the 50s by Monday than in the 70s.
Cheers,
-Bill
The 67 level on VIX has recently provided strong support/resistance area. As of now, VIX is at 66, up 3%+... Can't wait to see the 780 area again on SPX!
Post a Comment