Showing posts with label FXI. Show all posts

Monday, February 27, 2017

Ten Years Since the Biggest VIX Spike Ever

Ten years ago today, we witnessed that largest one-day VIX spike in the nearly three decade history of the VIX.  On that day, the VIX rallied from a prior close of 11.15 to 18.31 – a 64.2% gain.  The move came in conjunction with a 3.5% decline in the SPX (large, but nothing like what would follow during the next two years) and followed overnight concerns related to the Chinese government raising interest rates to discourage speculation.  The fears in China were largely responsible for a 8.8% loss in the Shanghai Composite Index and a 9.9% loss in the FTSE/Xinhua China 25 index that is the basis for the popular Chinese ETF, FXI.

In retrospect, the biggest VIX spike of all was a short-lived phenomenon whose fundamental and technical underpinnings turned out to pose no lasting threats.  As is often the case, traders who faded this move (and keep in mind there were no VIX ETPs available at that time) and bet on mean reversion cleaned up on that trade.

So, did this move in 2007 provide a hint as to what would follow in 2008?  As I see it, the timing was merely a coincidence.

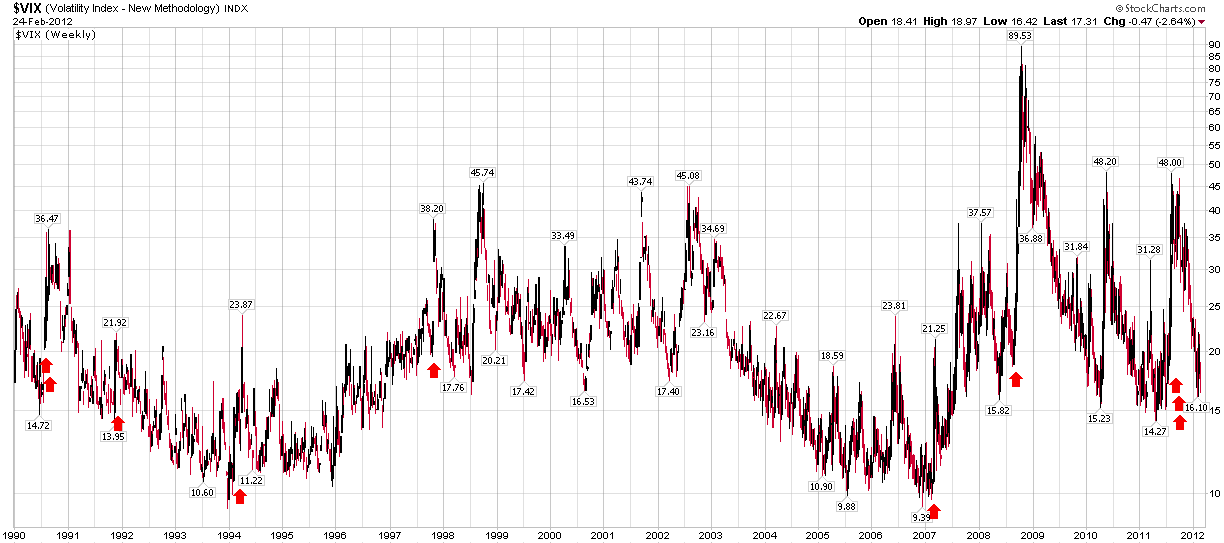
It may not be a coincidence, however, that the biggest VIX spike in history helped to usher in the golden era of VIX spikes, with 15 of the top 22 one-day VIX spikes of all time having occurred during the past decade, as is reflected in the graphic below.  Of course, most of the spike in VIX spike activity was the result of the Great Recession and some of the “disaster imprinting” that followed such a severe shock to many investor psyches.

[source(s): VIX and More]

Some may look around at a VIX that is not too much different now than it was a decade ago and wonder what it might take to trigger another 64% jump in the VIX.  Certainly there is a huge policy uncertainty overhang at the moment, lots of political (and related economic) uncertainty in Europe and there are always some black swans lurking just out of our sightlines.

For now, however, will just have to live with that eerie, unsettling feeling that often accompanies low volatility and wait for another bump in the night before we reassess the volatility landscape.

Further Reading:


For those who may be interested, you can always follow me on Twitter at @VIXandMore


Disclosure(s): none

Tuesday, July 2, 2013

Charting the Recent Decline of the BRIC Components

U.S. stocks are mostly green in today’s session, though there is a good deal of red in global stocks, notably in emerging markets, where the popular EEM emerging markets ETF is down close to 1% as I type this and the Brazil (EWZ) is down more than 2%.

In the chart below, I plot the recent decline of the four large BRIC emerging market country ETFs: Brazil (EWZ); Russia (RSX); India (EPI); China (FXI). While all four country ETFs have declined between 8% and 20% during the past six weeks, the various woes afflicting each country appear to be country-specific to a large extent, though obviously the issues affecting China’s manufacturing base and export market have a significant upstream impact on Brazil.

Emerging markets in general have been struggling as of late, but difficulties in Brazil, India and China have helped to fuel a global selloff.

Going forward, investors will be well-served to keep an eye on all four components of the BRIC block, as well as aggregated BRIC ETFs, such as the most popular issue in this space: the iShares MSCI BRIC Index (BKF).

For those who are interested in evaluating the risk and uncertainty in emerging markets in general, the recent VEXXM as a Measure of Emerging Markets Volatility and Risk is recommended reading for some background and information on VXEEM, the CBOE Emerging Markets ETF Volatility Index.

[source(s): StockCharts.com]

Related posts:

Disclosure(s): long EEM at time of writing

Thursday, June 20, 2013

VXEEM as a Measure of Emerging Markets Volatility and Risk

If you think U.S. stocks have been through a rough patch as of late, then you haven’t been paying attention to emerging markets stocks, where the popular EEM emerging markets ETF as fallen from a high of 42.96 on May 22nd to 37.02 earlier today – a 13.8% drop in less than one month. A large part of the problem has been the performance of the BRIC countries, where Brazil (EWZ), China (FXI) and India (EPI) are all acting as if they have been thrown overboard with anchors tied to their ankles, making Russia (RSX) look like the most stable investment of the group – which is quite a task.

Investors looking to monitor risk and uncertainty in Brazil and China are fortunate enough to have dedicated volatility indices based on the VIX methodology for EWZ and FXI. These volatility indices were created by the CBOE and use the tickers VXEWZ and VXFXI, respectively. For a more holistic view of risk and uncertainty in the emerging markets space, the best choice is probably VXEEM, the CBOE Emerging Markets ETF Volatility Index that is calculated based on options in EEM.

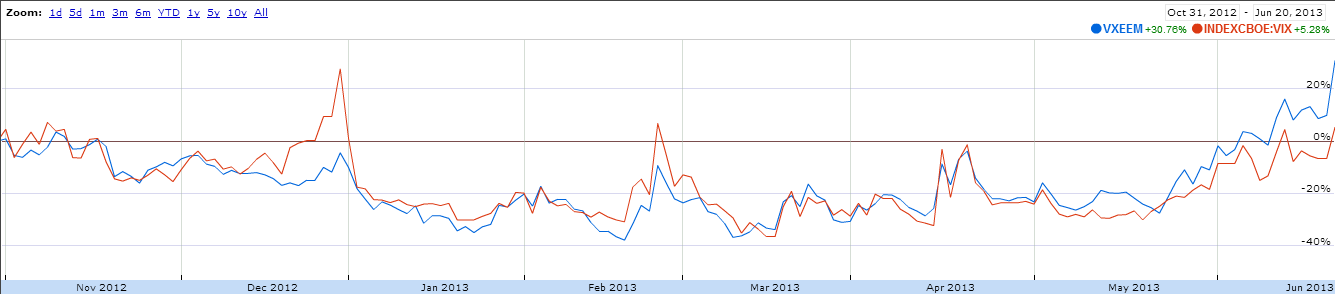
The chart below shows the relative performance of VXEEM and the VIX going back to the end of October 2012. Note that during toward the end of 2012, the debate over sequestration caused the markets to assign much more additional risk and uncertainty to U.S. stocks than to emerging markets stocks. During the course of the last month or two, this relationship has reversed and the risk and uncertainty associated with VXEEM has grown at a much faster rate than that of the VIX. On average, the absolute level of VXEEM is about 40% higher than that of the VIX. This week, however, VXEEM has been about 60% higher than the VIX.

On a related note, I find it interesting that S&P announced the launch of the S&P Emerging Markets Volatility Short-Term Futures Index just ten days ago. With that index in place, it would be relatively easy to create a futures-based emerging markets volatility ETP that would function in the same manner as VXX, but be based on VXEEM rather than the VIX. The biggest obstacle to this type of product is probably the current lack of liquidity in the VXEEM futures market.

[source(s): Google Finance]

Related posts:

Disclosure(s): short VXX at time of writing

Sunday, April 15, 2012

Chart of the Week: Don’t Blame China

Last week’s financial headlines were dominated by Spain and China. In the case of Spain, this was largely due to increased borrowing by Spanish banks from the European Central Bank. For China the culprit was Q1 GDP growth of only 8.1%, which was down from 8.9% in Q4 2011 and well short of the 9.0% whisper number that made the rounds in the day leading up to Friday’s announcement. In fact, once could certainly argue that it was China’s GDP whisper number that was the main catalyst for Thursday’s big rally that was essentially reversed on Friday.

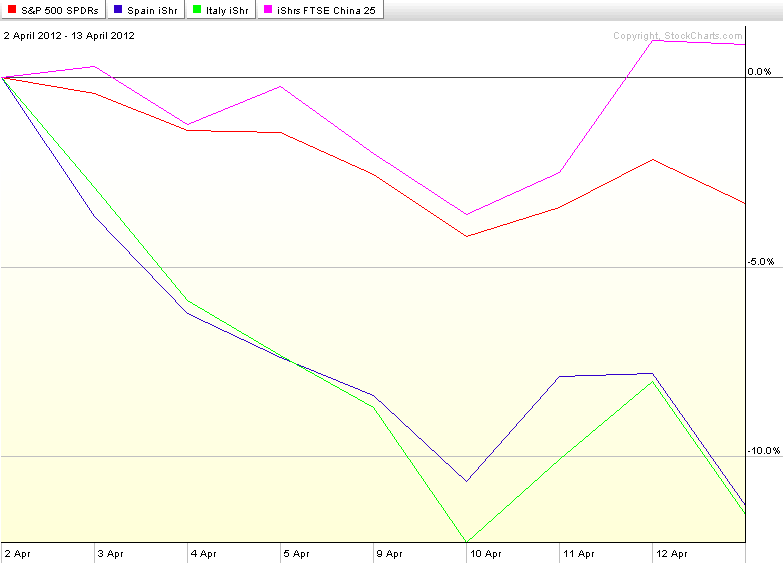
The chart of the week below shows the performance of SPY as well as country ETFs for Spain (EWP), Italy (EWI) and China (FXI) since stocks put in a top two weeks ago tomorrow. The chart shows that while SPY has been declining, country ETFs for Spain and Italy have been falling approximately three times as quickly as their American counterparts. And China? Well, don’t blame China for the woes in the U.S. stock market. While U.S. stocks have been selling off, the performance of the popular iShares FTSE/Xinhua China 25 Index, FXI, has managed to post a 0.9% gain.

[As a side note, about a year ago I discontinued the Chart of the Week, an extremely popular feature in this space since its launch in 2008, as my posting had become sporadic. Going forward I hope to be able to continue my recent regular posting and make this a weekly feature that not only shines a light on key developments of the past week, but also has some archival value as well.]

Related posts:

[source(s): StockCharts.com]

Disclosure(s): none
Friday, March 30, 2012

Why Not Point Hedges?

When most people think of hedges, they think in broad terms like hedging an entire long equity portfolio with SPX/SPY puts or VIX calls or some similar product. The thinking is typically that it is better to have broad-based protection against a bear move in stocks and/or a spike in volatility than to build only one castle wall facing the direction in which an enemy attack is expected. More often than not, it is the unexpected that wreaks havoc on a portfolio, not the white swan that slowly morphs into ivory, then light gray, then…

I might as well say this up front: I hate hedges. I love the idea of hedges, but when it comes time to pay for one, they invariably come across as more expensive than even a reasonably effective market timing strategy. Of course, there are all kinds of hedges, from those that are limited to disaster protection insurance to those that are intended to counteract even the slightest nick to a portfolio. If I feel like I can get my hedges at a discount (Groupon, are you listening?) then I will gladly ante up and enjoy the safety net.

Now there are some out there who think that some of the risks to stocks, particularly domestic equities, are being exaggerated by most investors. Those who hold this opinion might be better served to avoid a broad-based hedge and think in terms of what I call a point hedge. Simply stated, a point hedge is a rifle approach to portfolio protection rather than a (full perimeter) castle wall approach.

Perhaps an example will help to illustrate the point hedge approach. Let’s assume that an investor thinks that the U.S. economy will do better than the doomsayers predict and even fulfill James Altucher’s prediction, which was far-fetched at the time, that the SPX will hit 1500 in relatively short order. If that’s the case, then should the rifle be aimed? Let’s further assume that this bullish investor is primarily concerned about a worsening conflict between Iran and Israel, Spanish fiscal issues starting to resemble the Greek crisis, a possible hard landing in China and the rise of cyberwarfare.

Rather than construct a broad-based hedge, it is possible to create a more cost-effective portfolio hedge by aggregating point hedges across all four areas of concern. For Iran and Israel, something like a long position in Brent crude oil (BNO) might do the trick. As far as Spain is concerned, purchases of puts in the country ETF (EWP) would be appropriate, but a more liquid and perhaps more targeted approach might be long puts in Spain’s largest bank, Banco Santander (STD). There are many alternative approaches in China, but certainly a short position in FXI or some long puts in that ETF is one approach worth investigating. Last but not least, cyberwarfare presents a different set of problems, but some of the firms where call purchases might be hedges against a spike in cyberwarfare are SAI, CHKP, FIRE, FTNT and SYMC.

Of course this is just one of many potential list of threats to the stock market and possible point hedges that might be used to counteract them. Even if you prefer the blanket coverage of a broad-based hedge, it is usually worth the time and effort to draw up a list of potential threats and stocks/ETPs that might be employed to counteract those threats or perhaps even provide some speculative gains.

On a related note, I realize that I have only periodically been applying the “hedging” label to my posts, so I reviewed quite a few posts in the archives and have begun to retroactively apply that label to those posts (such as several in the list below) which might be of particular interest to financial archeologists.

Related posts:

[graphic: Scaliger Castle, Sirmione, Italy – Library of Congress]

Disclosure(s): long FIRE at time of writing

Monday, February 27, 2012

The Biggest VIX Spike Ever: A Retrospective

Here is a thought experiment: when was the biggest one day VIX spike ever recorded? If you said February 27, 2007 – five years ago today – then I imagine you are in the distinct minority, even among active traders of VIX products.

There were a number of factors which helped to trigger the mostly forgotten record VIX spike back in 2007 – and with it a 3.5% decline in the S&P 500 index. Most media reports at the time focused on a drop in Chinese stocks. In fact, as I noted later, concerns about the Chinese government raising interest rates to discourage speculation helped to trigger an 8.8% loss in the Shanghai Composite Index and a 9.9% loss in the FTSE/Xinhua China 25 index that is the basis for the popular Chinese ETF, FXI. Various other news reports pointed to concerning U.S. economic data and there were some who were apparently spooked by a Taliban suicide bombing attack in Afghanistan that targeted Vice President Dick Cheney.

Interestingly, concerns about a sub-prime crisis or a real estate bubble were almost nowhere to be found at the time.

Of course the world was a lot different back in 2007. I had just started blogging one month before the VIX spike and in a world where a sub-10 VIX was common, I added the tongue-in-cheek tagline to the blog: “Your One-Stop VIX-Centric View of the Universe…” Twitter was in its infancy, CNBC hadn’t even thought about the idea of running a VIX ticker across your TV screen and most people didn’t even know what the VIX was at that time.

For those who may be interested in a little financial archeology, I put up eight posts that day to chronicle the magnitude of the move and offer an interpretive wrapper for those who were looking for more information:

…and added some trading ideas in another post prior to the next day’s open:

Note also that the blogging world was much smaller and more intimate in those days, so I was not surprised to see that David Merkel, Trading Goddess, Option Pundit, Jim Kingsland, Headline Charts, Lauriston Letter and other blogging luminaries of that era dropping by to add their thoughts in the comments section.

Of course this is where I typically get peppered with dozens of, “So what does a big one day spike in the VIX mean?” questions, so I have taken the liberty of highlighting the ten largest single day VIX spikes over the last 22 years (which includes reconstructed VIX calculations). As I see it, these one day spikes are typically instances in which a number of investors suddenly get their first glimpse of a dark gray swan and they panic, not knowing what is around the corner. For the most part, the panic turns out to be an overreaction. Of course, occasionally the big spike can look like a precursor of doom in retrospect, as was the case on September 29, 2008, when the VIX spiked 34.5%, just before stocks went into their plunge. When I see a big VIX spike, however, the first thing I do is get out my mean reversion trading kit.

Related posts:

[source(s): StockCharts.com]

Disclosure(s): long FXI at time of writing

Thursday, November 4, 2010

Chinese Stocks Thump U.S. Counterparts

With all the discussion of quantitative easing and elections, it is all too easy to adopt (or continue to cling to) an Americentric view of the investment world.

The truth is, however, that the bulls have been doing much more damage in China as of late than in the United States.

The chart below shows the performance of FXI, the iShares FTSE/Xinhua China 25 Index, for 2010. Note that while much hoopla has been generated over the new 2010 highs in the S&P this week, FXI has repeatedly been making new highs for the year since the beginning of October and is now approximately 10% above previous highs.

Note also that in terms of relative performance (top study), FXI has been outperforming the S&P 500 index consistently going all the way back to the May 6th flash crash.

I have previously talked about thinking of China as a possible leading indicator for U.S. stocks. Recent data suggests that investors may want to give additional thought about the predictive power of Chinese stocks and reorient some of their geographic bias.

Related posts:


Disclosure(s): Long FXI at time of writing

[source: StockCharts.com]

Sunday, August 29, 2010

Chart of the Week: Irrepressible Colombia (GXG)

While U.S. investors can be forgiven for thinking that stocks have been stuck in a fairly narrow trading range for the last 3 ½ months, those who are scanning the globe for investment ideas are likely to have seen an entirely different investment climate.

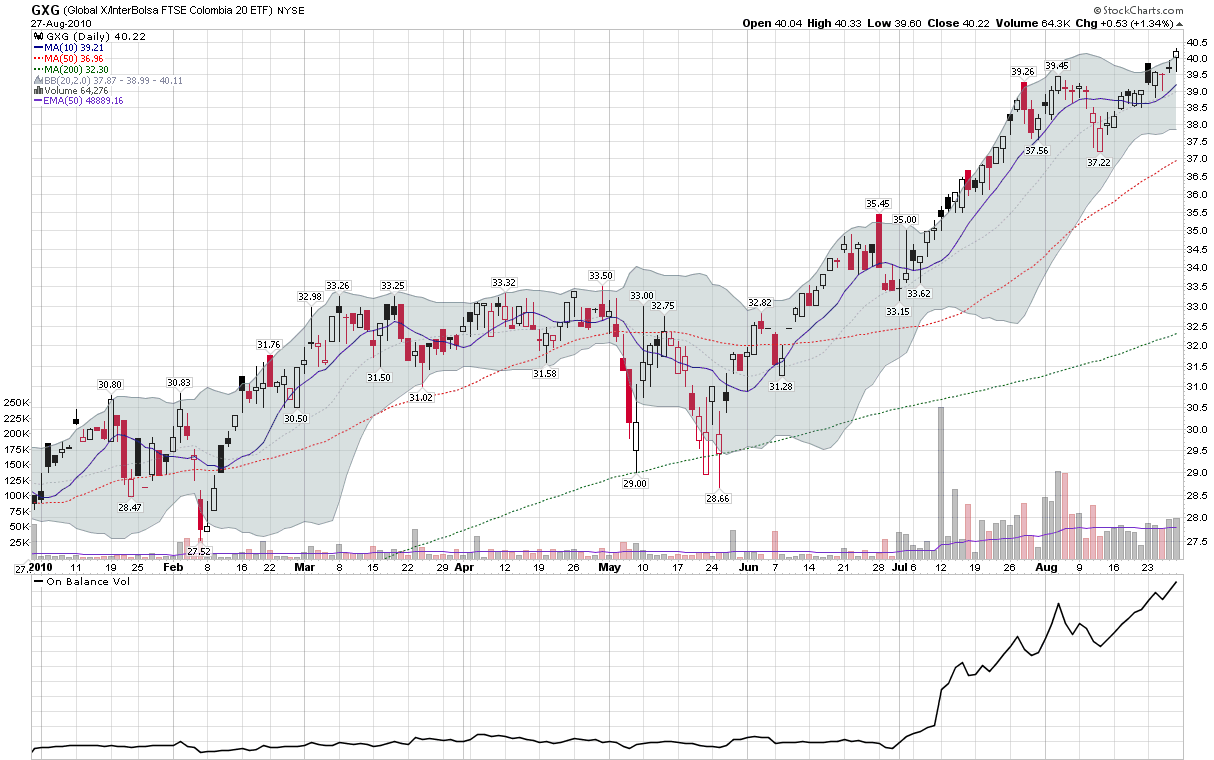
A case in point is the Global X/InterBolsa FTSE Colombia 20 ETF (GXG), which has regularly been showing up as one of the top geography-based ETFs in my weekly newsletter. GXG is up 42% in 2010, handily outdistancing the BRIC ETF, EEB, and the popular broad-based emerging markets ETF, EEM, which are down -4.8% and -1.8% year-to-date, respectively.

Whereas BRIC has been a popular emerging markets investment theme for the past few years due to the popularity of Brazil (EWZ), Russia (RSX), India (EPI) and China (FXI), some have suggested that the current decade may turn out to be the decade of so-called frontier ETFs, with countries like Colombia, Indonesia (IDX), Vietnam (VNM), Egypt (EGPT), Turkey (TUR) and South Africa (EZA) among the top performers. These frontier ETFs already have their own catchy acronym, CIVETS, in order to make them easier to recall.

In terms of economic firepower, don’t expect the CIVETS to displace the BRIC countries, but when it comes to returns, the CIVETS are already off and running. With the best performance of any country ETF so far in 2010, Colombia has been acting like the new lead dog and has earned the spotlight as this week’s chart of the week.

Related posts:


[source: StockCharts.com]

Disclosure(s): long GXG, IDX and VNM at time of writing

Sunday, January 24, 2010

Chart of the Week: Weekly FXI

Investors who have been waiting for a significant VIX spike to signal a changing of the guard in investor sentiment finally got something to sink their teeth into last week. On the other hand, investors who have been watching China closely have seen a slowly deteriorating picture since about mid-November.

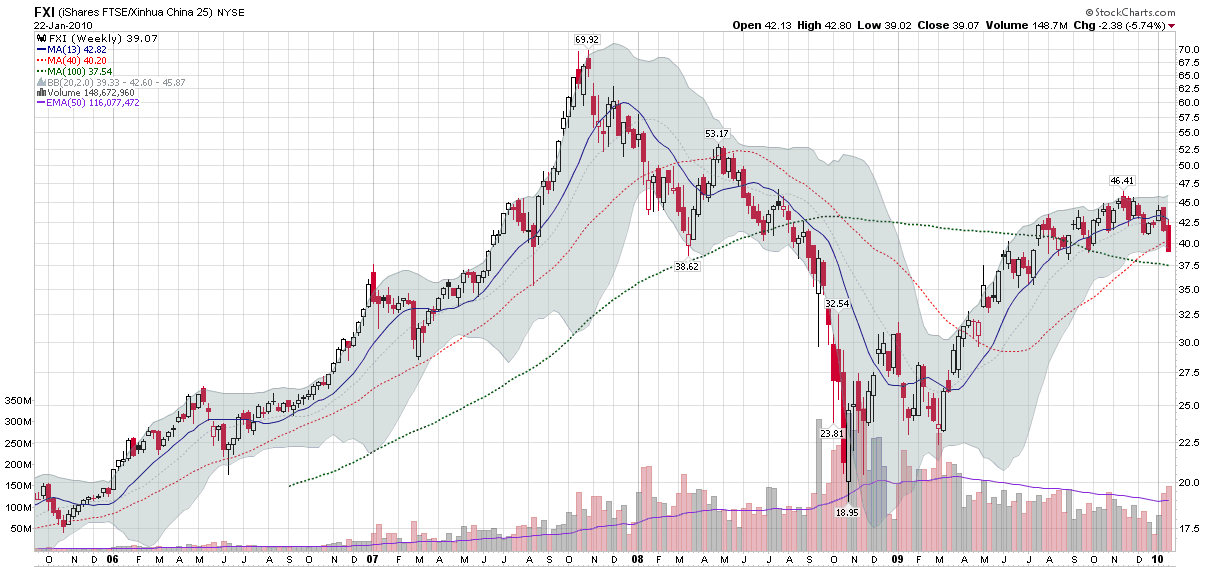
In fact, FXI, the iShares FTSE/Xinhua China 25 Index, is now down 15.8% from its November high water mark and after declining sharply on large volume for the past two weeks is now below its 40 week (200 day) moving average.

As this week’s chart of the week shows, FXI has been locked in a largely sideways pattern since last July after retracing approximately 54% of the fall from an October 2007 high of 69.92 and a subsequent low of 18.95 in October 2008.

Note than in short pullbacks from 2005-2007, the 40 week moving average acted as support. Last week’s breach of the 40 week support line looks more serious than anything experienced during 2005-2007. Should FXI not be able to close this week above the 40 week moving average, I would not be surprised to see that level flip from support to resistance and further confirm that Chinese stocks are in a bear market.

For more on related subjects, readers are encouraged to check out:

Also, for an excellent blog devoted to the fundamentals of the Chinese economy, I highly recommend China Financial Markets by Michael Pettis.

[source: StockCharts]

Disclosure: none

Monday, December 14, 2009

The BRIC Bull

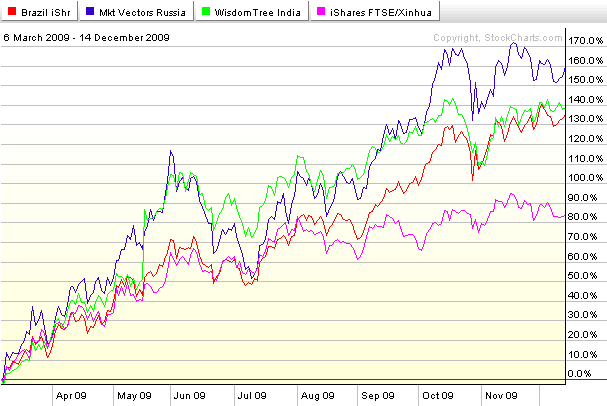
The last time I wrote about the relative performance of the BRIC countries was a little over eight months ago, in Russia Leading the BRIC Rally. At that time, the bounce off of the March lows was barely a month old and Russia (RSX) was leading the way, followed closely by India (EPI), with Brazil (EWZ) and China (FXI) not rallying quite as sharply.

Fast forward eight months and Russia is still out in front, but starting to look a little tired. For all the talk of a Chinese bubble, FXI, the most popular Chinese ETF, is a distant fourth and falling farther behind the other BRIC ETFs with each passing week. Since the end of October, the top performers have been India and Brazil. In fact the top India ETF (EPI) is now 21% higher than it was the day before the Lehman Brothers bankruptcy, while the Brazil ETF is 29% higher than its was trading just before the Lehman debacle.

Looking ahead to 2010, I expect Russia will have considerable difficulty remaining the top performer. I would not be surprised to see Brazil eclipse the bunch, followed by India and a resurgent China. One thing is certain: if investors can predict the plight of the BRIC ETFs in 2010, quite a few of the other pieces of the investment puzzle will magically begin fall into place.

For more on related subjects, readers are encouraged to check out:

[source: StockCharts]

Disclosure: none

Sunday, August 16, 2009

Chart of the Week: China Through the Eyes of FXI

One of the biggest stories of 2009 is turning out to be the rapid rebound in the China, both for the economy and for Chinese stocks.

Second quarter GDP was up 15% quarter-over-quarter in China and industrial production is up 10.8% year over year through July. A number of other statistics also show strong growth returning to China following the enactment of recent stimulus measures. Additionally, when pressed for areas of current and future revenue growth in their recent earnings conference calls, American companies were quick to point to the strong rebound in China as one of the few or sometimes the only area of growth.

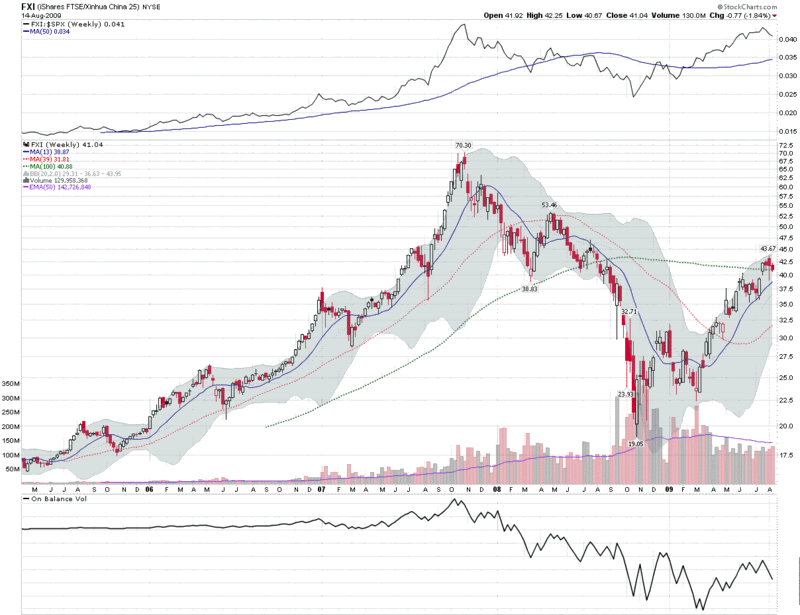
For these reasons, I have made FXI, the iShares FTSE/Xinhua China 25 Index, the subject of this week’s chart of the week. The chart below is a weekly chart of FXI going back to April 2005 and shows the dramatic gains of 2006 and 2007, the subsequent crash from October 2007 to October 2008, and the 129% bounce from the October bottom to the August 3rd top. In the two weeks since topping, FXI has fallen about 6.4%.

In the last year, Chinese stocks bottomed before their U.S. counterparts, had a much more significant bounce off of that bottom, and also topped before U.S. stocks did. Are Chinese stocks pointing to a correction? Can U.S. stocks continue to make new highs without new highs from Chinese equities? Will technical resistance at the 100 week moving average become a significant hurdle for FXI? I expect we will have much better answers to these questions before Labor Day rolls around.

For two excellent resources on Chinese markets, I recommend:

[source: StockCharts]

Monday, August 10, 2009

The TAO of Chinese Real Estate

Two places where investors have done extremely well since March are China and real estate. Some investors have undoubtedly been lucky enough to find themselves at the intersection of these two bullish themes by being invested in Chinese real estate.

Historically, gaining significant exposure to Chinese real estate has been at best unwieldy for U.S. investors. In December 2007, however, investors were given a shortcut to Chinese real estate with the launch of the Claymore/AlphaShares China Real Estate ETF, which seeks to match the performance of the AlphaShares China Real Estate Index and sports the slightly-too-cute ticker TAO.

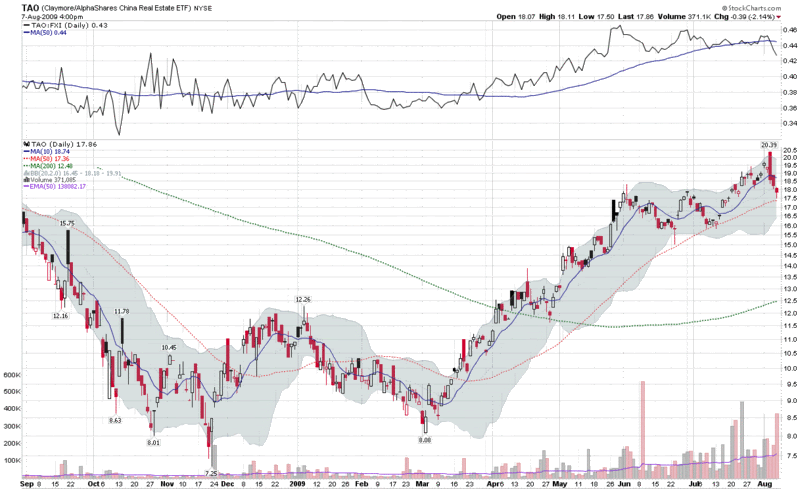
For about a year and a half, TAO received very little attention and struggled to put together an occasional 100,000 share day, but as Chinese stocks rebounded, TAO started gathering a following. For the last two months, volume in TAO has been improving and this formerly niche ETF has started to attract a mainstream following.

Last week, TAO peaked at 20.39, more than 2 ½ times the March low of 8.08. As the chart below shows, since last week’s high, TAO has begun to come under some selling pressure, both on an absolute basis and relative to FXI, the popular Chinese ETF (see top study.) Going forward, TAO is an interesting way to keep an eye on speculative trends in the Chinese real estate market.

Finally, don’t be surprised if Chinese securities start to exhibit more of a bellwether role for global securities.

[Thanks to Market Rewind for bringing TAO to my attention.]

[source: StockCharts]

Saturday, April 11, 2009

Russia Leading the BRIC Rally

The last time I checked in with the BRIC countries, four months ago, the issue de jour was BRIC Update: China a Leader or an Outlier? At that time, China was starting to move impressively off of an October bottom and Russia was a notable laggard.

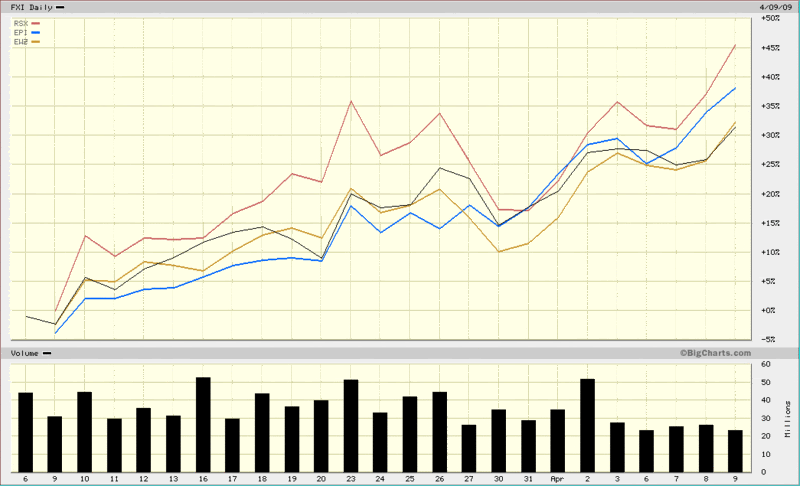
As the chart below shows, in the five weeks since the U.S. stock indices have bottomed, it is Russia (RSX, red line) that has been the strongest performer, followed by India (EPI, blue line), with Brazil (EWZ, gold line) and China (FXI, black line) bringing up the rear.

I watch these relationships closely for a number of reasons, not the least of which is to determine how well the group as a whole is performing, if any particular country is separating itself from the pack, whether commodity producers or consumers are in favor, etc.

Part of the reason Russia has bounced more than its BRIC counterparts is that Russia suffered disproportionately in the recent bear market. In the nine months from June 2008 to February 2009, the RSX Russian ETF lost more than 82% of its value. The last month, however, has seen some notable improvements. Russia’s credit default swaps, for instance, which reflect to the cost to insure the country’s debt, have improved from 694 to 412 in the last four weeks as the outlook for that country’s sovereign debt has improved dramatically.

Going forward, country-specific trends may continue to dominate, but I suspect the relative performance of Russia and Brazil will say more about improvements in the commodities market as a whole than about the plight of a particular national economy.

[source: BigCharts]

Friday, February 27, 2009

Volatility Storm at Two Years and Counting…

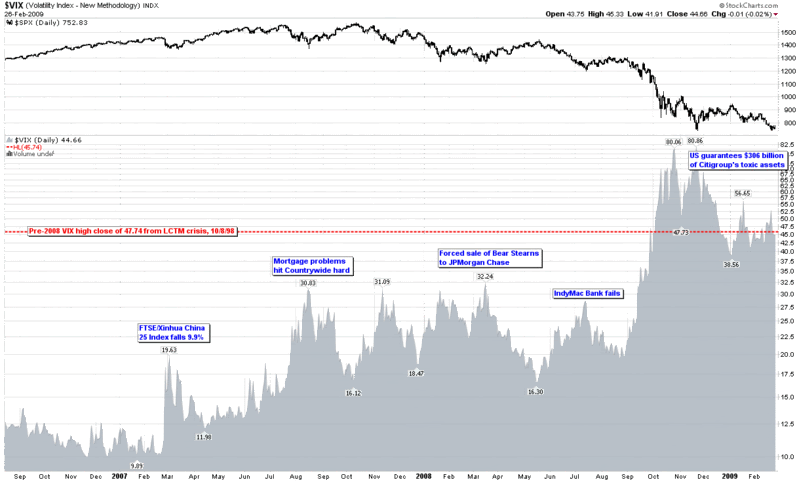
It was exactly two years ago today that the first winds of the volatility storm blew in from China. Back on February 27, 2007, concerns about the Chinese government raising interest rates to discourage speculation helped to trigger an 8.8% loss in the Shanghai Composite Index and a 9.9% loss in the FTSE/Xinhua China 25 index that is the basis for the popular Chinese ETF, FXI.

In one of the earlier challenges to the decoupling theory, stocks around the world fell in sympathy, with the Dow Jones Industrial Average losing 416 points later that day to close at 12,216. The simultaneous 64% spike in the VIX still stands as a one day record, though two years later it seems a little quaint to talk about a massive VIX spike when the VIX failed to get out of the teens.

As the chart below shows, following the February VIX spike, the floor in the VIX jumped from 10.00 to 12.00 and that floor kept rising, first to 15, then 16, 18 and 22. In fact, the pattern of higher lows continued for over a year.

In the StockCharts chart, I have elected to show volatility as an area chart to emphasize the rising tide aspect of volatility. Even though the May 2008 bottom prints as a lower low and the IndyMac Bank failure in July shows up as a lower high, this turned out to be the last glimpse of somewhat normal volatility before September 2008 unleashed the full force of the volatility storm. For easy reference and archival purposes, I have highlighted a handful of fundamental events that coincided with some of the important tops in the VIX in the past two years.

It has now been two full years and counting since the big drop in China and the first global volatility ripples, yet only a few hearty souls are willing to go out on a limb and predict that the worst is behind us.

Frankly, it think it is unlikely – though certainly not out of the realm of possibility – that we will see the VIX close over 80 again during the next decade, but then again two years ago no one was predicting that it would be so easy to keep the VIX above the 40 level for five full months.

This storm will eventually blow itself out, but the coastline will never look the same again.

[source: StockCharts]

Tuesday, December 9, 2008

BRIC Update: China a Leader or Outlier?

I have commented on resurgent Chinese stocks several times in the past few weeks, most recently in China About to Break Out? Now that Chinese stocks (FXI, black line) appear to be on the rebound, an important question is whether this is an isolated phenomenon or one that will also affect other emerging markets economies.

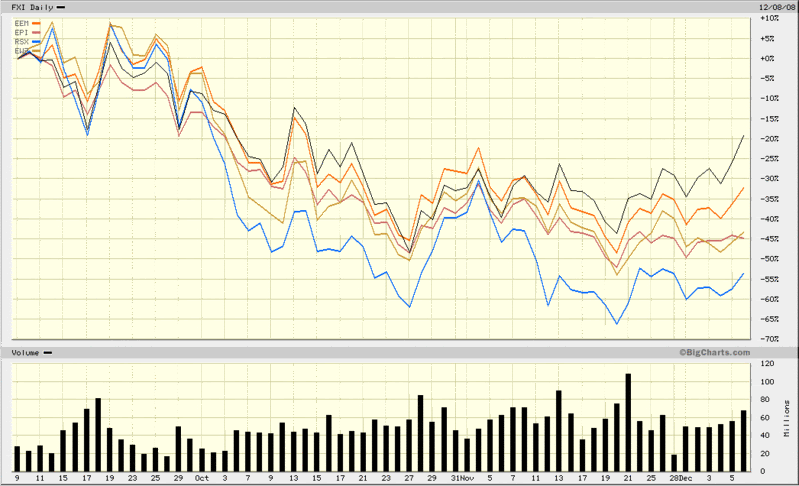
As the chart below shows, the rally in Chinese stocks has significantly outdistanced the recent bounce in emerging market stocks (EEM, orange line). It is the other three members of the BRIC group, however, that are lagging China and the broad emerging markets group the most. Not surprisingly, commodity-rich Russia (RSX, blue line) is the biggest laggard among the BRIC countries, while India (EPI) and Brazil (EWZ) are trailing the broader emerging markets index, but performing better than Russia.

The question of whether growing domestic demand and a massive government stimulus package will result in a China-specific rebound or help pull other global economies along for the ride is not likely to be answered soon. In the meantime, China looks strong on a relative basis and other emerging economies should be watched closely for clues about the geographical breadth of the rally.

[source: BigCharts]

Thursday, December 4, 2008

China About to Break Out?

It was only ten days ago that I thought I would be provocative with an early call on China in Time to Be Long China? Since that time, what looked like a possible cessation in downside momentum has turned decidedly more bullish, with the FXI rising an additional 10%.

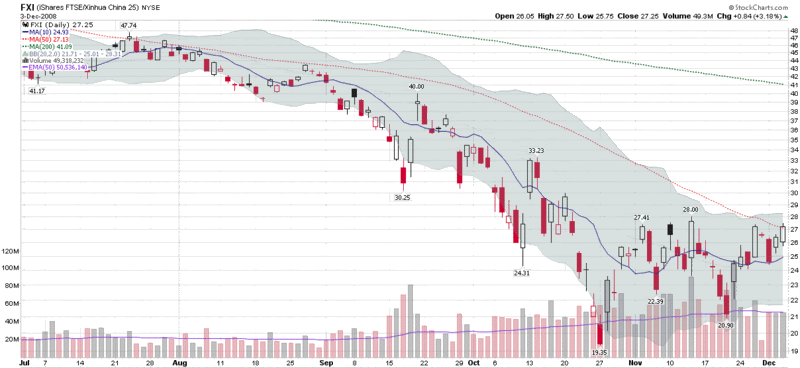
The chart below shows FXI, the iShares FTSE/Xinhua China 25 Index ETF, closing above its 50 day simple moving average (SMA) for the first time in 4 ½ months yesterday. It has been 27 trading days since the FXI put in a bottom. Since that time, the Chinese ETF has rallied more than 40% off of that bottom.

If FXI can close above its 50 day moving average again today, it will mark the first time in over six months that FXI has closed above that important technical level on consecutive days. Ten minutes into today’s session, FXI is trading at 26.70, down 0.55. With the 50 day SMA at 26.94, any close at 27.00 or above should leave a fairly bullish signal on the chart and support the case for increasing upside momentum.

[source: StockCharts]

Monday, November 24, 2008

Time to Be Long China?

Back on October 10, 2007, in a post with the title When to Short China? I predicted:

Eventually, there will come a time when you will look back and say to yourself, “Why wasn’t I short China? It was such a no-brainer…”

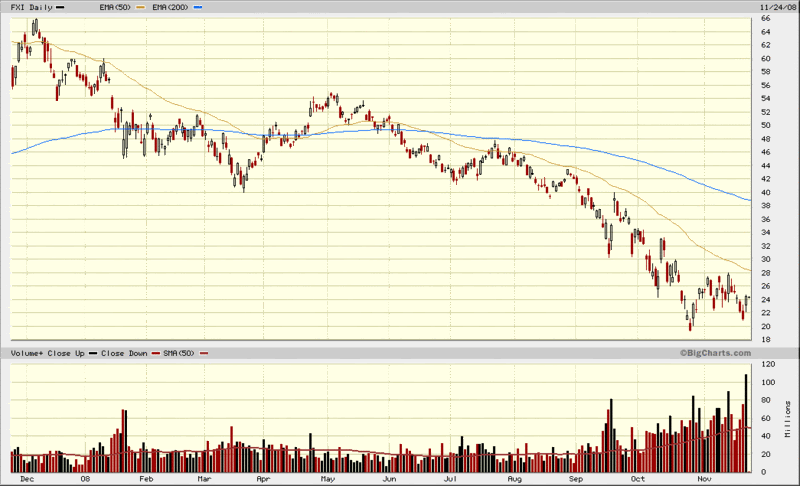
In the 13 ½ months since that post, the iShares FTSE/Xinhua China 25 Index (FXI) has fallen from a split-adjusted 63 to 24 and change, a loss of about 62%.

Now predicting tops and bottoms is always a dangerous parlor game, but investors should always be wary of potentially important tops and bottoms.

Returning to China, notE that in the chart below, last week’s low in the FXI was about 5% higher than the October low, with Friday’s rebound accompanied by record volume. I would not likely confirm a rally in FXI until it closed over 28 or so, but the signs of a bottom look more promising in the FXI than they do in many corners of the U.S. equity markets.

There is considerable disagreement about how much of the $586 billion Chinese stimulus package accounts for new spending and how much references projects that had already been committed to, but were relabeled to fit under the stimulus umbrella. There is also a broad range of opinions around the amount the Chinese economy has slowed, with current estimates pointing to economic growth of 7% at the high end to perhaps the possibility that the Chinese economy might be shrinking. As additional light is shed on these issues, expect the FXI to lurch dramatically up and down. Do not be surprised, however, if the October 27th low of 19.35 turns out to be the bottom.

[source: BigCharts]

Thursday, June 12, 2008

A Weekly Perspective on the FXI

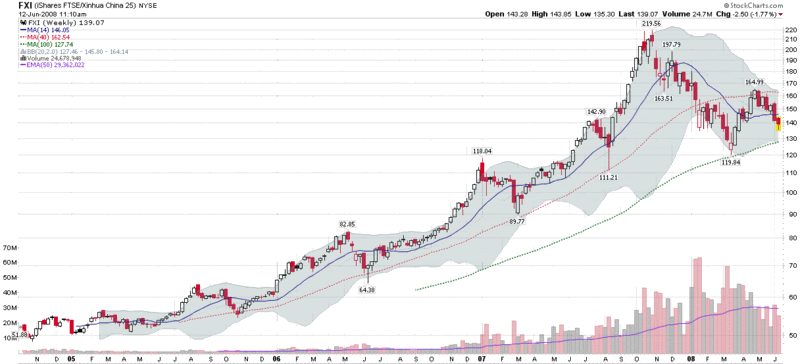
Yesterday afternoon, one of my favorite trading systems, a self-styled ETF reversal swing trader, gave a signal to go long FXI, the iShares FTSE/Xinhua China 25 Index (for those who are interested, the 29 components and weightings of the FXI are available from the iShares FXI holdings page.)

If one looks at the daily chart of the FXI, there is not much in the chart to inspire bullish optimism, as FXI has fallen by 35% since late October and has logged distribution days in three of the last four trading sessions.

When the action is particularly volatile on a daily basis, I like to spend more time with the weekly charts. In the case of FXI, zooming out to weekly bars offers a different perspective, with more in the way of bullish opportunities. In the weekly chart below, it is easy to discern that the 40 week simple moving average contained all of the pullbacks from 2005 to the beginning of 2008. Also of interest, the March low just touched the 100 week SMA before bouncing off of that level and moving up. As the current 100 week SMA is approaching the 130 level, yesterday’s 135.30 low looks like it may be a relatively low risk entry, with a potential short to intermediate-term upside target of 155 or more.

The Chinese markets are about as volatile as any at the moment and bullish reversal trades are notoriously risky, but this does not exclude the possibility of entries with a favorable risk-reward profile.

Monday, March 17, 2008

Portfolio A1 Doubles Down on Brazil

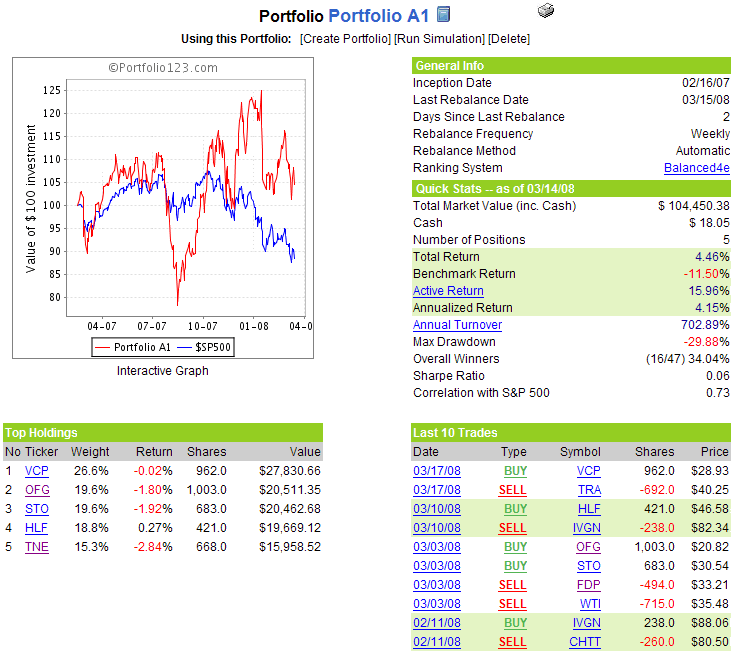
As a five stock portfolio that has sector concentration rules built in but no country or regional rules, there are occasional instances in which Portfolio A1 inadvertently takes multiple positions in a concentrated geographical area. This week is one of those instances, as the portfolio is selling fertilizer producer Terra Industries (TRA) after the company triggered an automatic sell rule by dropping 20% from the high during its holding period.

In lieu of TRA, the portfolio is adding Brazilian pulp and paper producer Votorantim Celulose e Papel SA (VCP), an ADR which I will henceforth conveniently refer to by their ticker. In Brazil Rallies While China Struggles, I recently noted how the Brazilian ETF (EWZ) had reflected the country’s recent superior performance relative to the more widely discussed China ETF (FXI); for those looking for individual Brazilian equities, you may wish to add VCP to you watch list, as it looks like it may have pulled back to technical support. VCP joins Brazilian telecom standout Tele Norte Leste Participacoes SA (TNE); together these two companies will now comprise approximately 42% of the portfolio.

In spite of some recent weakness, Portfolio A1 still holds net performance advantage of 16% over the benchmark S&P 500 index, with a 4.5% cumulative gain vs. an 11.5% cumulative loss for the SPX.

There no other changes to the portfolio for the coming week.

A snapshot of Portfolio A1 is as follows:

Tuesday, February 26, 2008

Brazil Rallies While China Struggles

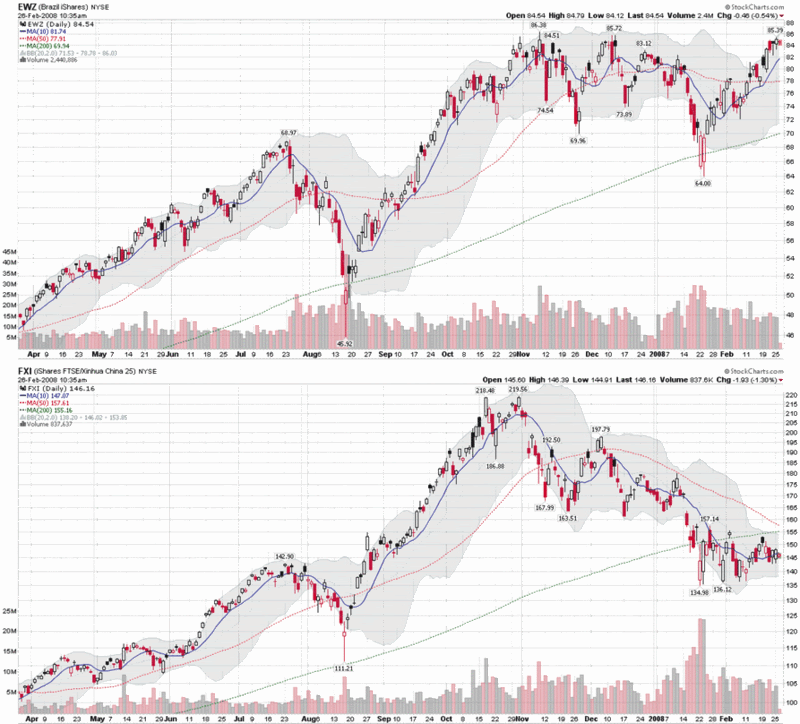
As the chart below shows, speculative money has been cautious about China since late October, but still bullish on Brazil, as indicated by the strong performance in EWZ, the iShares MSCI Brazil Index ETF. Not only is EWZ showing a gain for the year, but in an impressive display of strength, it has rallied more than 30% off of the January low. This performance puts EWZ not only well ahead of the most popular Chinese ETF, FXI, but also considerably ahead of the broad market emerging market ETF, EEM, known formally as the iShares MSCI Emerging Markets Index.

While EWZ is a great way to play the Brazilian market, there are several ADRs that are worth singling out as well. My Portfolio A1 holds Tele Norte Leste Participacoes SA (TNE) and has also been long Brasil Telecom Participacoes SA (BRP) in recent months, but there are even better plays. In fact, of the handful of long-term global holdings that I believe you could almost buy and forget about, two of my favorites are Brazilian giants. At the top of the list is Petroleo Brasileiro SA (PBR), a.k.a. Petrobras, the superbly managed national oil company that is pushing the envelope in the ultra-deep recovery space with their massive Tupi oilfield. Close behind is Vale (RIO), formerly know as Companhia Vale do Rio Doce, the metals and mining giant that recently extracted a 65% price increase in iron ore prices from Baosteel, the largest steel company in China.

In a healthy global economy, PBR and RIO are two of the best blue chip oil and iron plays out there. For those wishing a broader, more diversified play, EWZ is hard to beat, especially as Brazil continues to outpace China.

DISCLAIMER: "VIX®" is a trademark of Chicago Board Options Exchange, Incorporated. Chicago Board Options Exchange, Incorporated is not affiliated with this website or this website's owner's or operators. CBOE assumes no responsibility for the accuracy or completeness or any other aspect of any content posted on this website by its operator or any third party. All content on this site is provided for informational and entertainment purposes only and is not intended as advice to buy or sell any securities. Stocks are difficult to trade; options are even harder. When it comes to VIX derivatives, don't fall into the trap of thinking that just because you can ride a horse, you can ride an alligator. Please do your own homework and accept full responsibility for any investment decisions you make. No content on this site can be used for commercial purposes without the prior written permission of the author. Copyright © 2007-2023 Bill Luby. All rights reserved.
 
Web Analytics