A Weekly Perspective on the FXI
Yesterday afternoon, one of my favorite trading systems, a self-styled ETF reversal swing trader, gave a signal to go long FXI, the iShares FTSE/Xinhua China 25 Index (for those who are interested, the 29 components and weightings of the FXI are available from the iShares FXI holdings page.)
If one looks at the daily chart of the FXI, there is not much in the chart to inspire bullish optimism, as FXI has fallen by 35% since late October and has logged distribution days in three of the last four trading sessions.
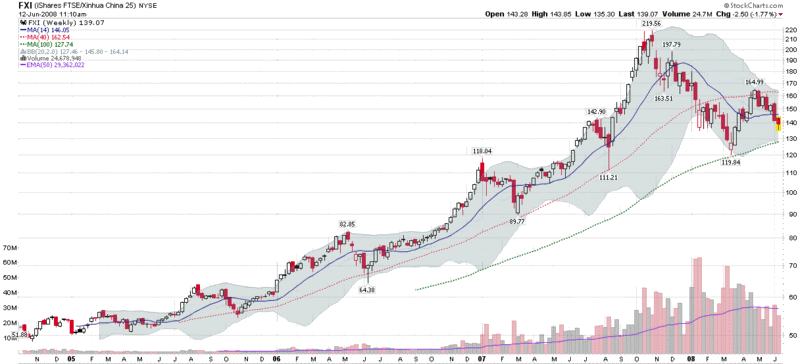
When the action is particularly volatile on a daily basis, I like to spend more time with the weekly charts. In the case of FXI, zooming out to weekly bars offers a different perspective, with more in the way of bullish opportunities. In the weekly chart below, it is easy to discern that the 40 week simple moving average contained all of the pullbacks from 2005 to the beginning of 2008. Also of interest, the March low just touched the 100 week SMA before bouncing off of that level and moving up. As the current 100 week SMA is approaching the 130 level, yesterday’s 135.30 low looks like it may be a relatively low risk entry, with a potential short to intermediate-term upside target of 155 or more.
The Chinese markets are about as volatile as any at the moment and bullish reversal trades are notoriously risky, but this does not exclude the possibility of entries with a favorable risk-reward profile.


5 comments:
FXI hit 2 standard deviations below its linear regression line on the 3 month daily.... is that close to your trading idea?
Hi Steve,
The indicator/system I use incorporates some aspects of historical volatility, implied volatility, and momentum, so I am not surprised that there is some correlation with the standard deviation approach you describe.
Of course oil and a number of other factors could shoot down a bounce in the FXI, but I think the odds favor a FXI bottom in the 130-135 range.
Cheers and good blogging/trading,
-Bill
Bill,
Thanks for the information. I mentioned the Linear Regression Channel because I recently learned about it (I think Tom Sosnoff from ToS brought it up in a lecture) and it seems to be a pretty reliable mean-reversion technique.
--Steve
http://www.tsptalk.com/comments.html
is a good site too;
thx for your work!
One major annoyance trading FXI (also with IFN,EWJ, etc) is that atleast on a short term basis, they correlate more with the US market than with the index of the their respective countries (as they are supposed to).
This makes them little more than leveraged plays on the US market.
Right now the Chinese market ($SSEC) is highly oversold and due for a bounce. Even if I'm right and it does bounce, I have no confidence FXI will reflect it.
-KS
Post a Comment