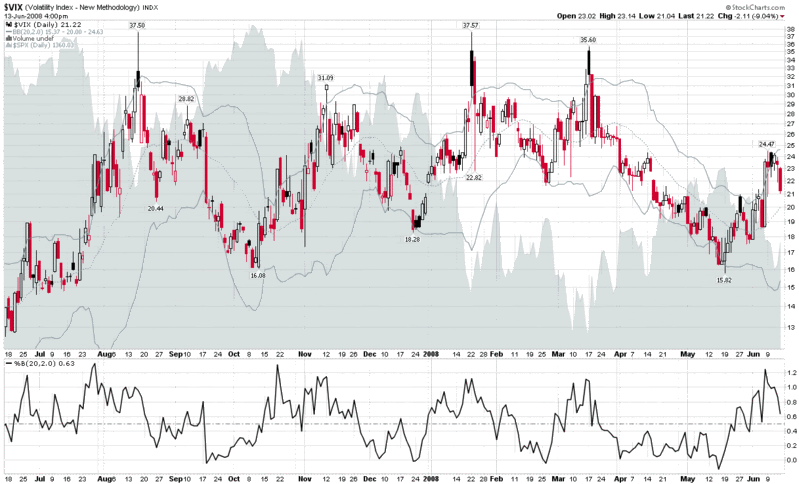
Bollinger Bands and the Percent B Setting
It occurred to me, as I reviewed my last two posts on Bollinger Bands, that it would take quite a few posts to do anything more than scratch the surface of the Bollinger Bands indicator. For that reason, I am going to set aside my thinking on Bollinger Bands after today’s third post in the series, with a promise to pick up the subject again at a later date.
Before I wrap up this introductory look at Bollinger Bands, I want to be sure to mention the %b indicator. Quite simply, %b calculates the current price relative to the top and bottom Bollinger Bands. A %b reading of 0.5 means that the current price is exactly at the middle band (the dotted line in the gray line in the graph below that is a 20 day simple moving average in the default setting). A 1.0 reading puts the current price exactly at the level of the top band and a 0.0 reading establishes that the current price is at the level of the lower band. Unlike some oscillating indicators, %b is unbounded, so in the chart below it will exceed 1.0 when the VIX spikes above the upper band (note the most recent instances of this in January, March and the first week of June.) Each 0.1 increment above 1.0 translates to 10% of the band width above the upper band, so that a %b of 1.25 would mean 25% of the band width above the upper band. In addition to spikes above the upper band, when the VIX drops rapidly, it will periodically slide into negative territory, as it did most recently in February and May.
The %b indicator can also help to identify a change in the volatility climate. If one studies the %b peaks in late July and mid-October of last year, these %b readings of over 1.2 were nowhere the VIX tops. In each instance, however, the extreme %b readings did signal a dramatic change in volatility that ultimately ended with a volatility climax about three weeks after the 1.2+ readings in the %b indicator.
Finally, from a systems development perspective, consider that while converting Bollinger Band chart data into mechanical signals may seem like a daunting task, the %b numbers are often ideally suited for this purpose.


2 comments:
The chart shows another spike, just barely over 1.2, on June 5. So the next data point for the theory would be a low around June 26.
Howdy
On checking my 3 month charts for indexes i noticed that the $DOT, $XOI, $XAU, and the XCI are about to make a bad cross of the 50dma or 200dma with the 20dma are we close to a decision point?
Mac
Post a Comment