Volatility at RKH Regional Banking ETF
I just mentioned RKH, the HOLDRS regional banking ETF, on Wednesday in Regional Banking Woes Worsen, where I also posted a graph of RKH’s six month stock price and 30 day implied volatility.
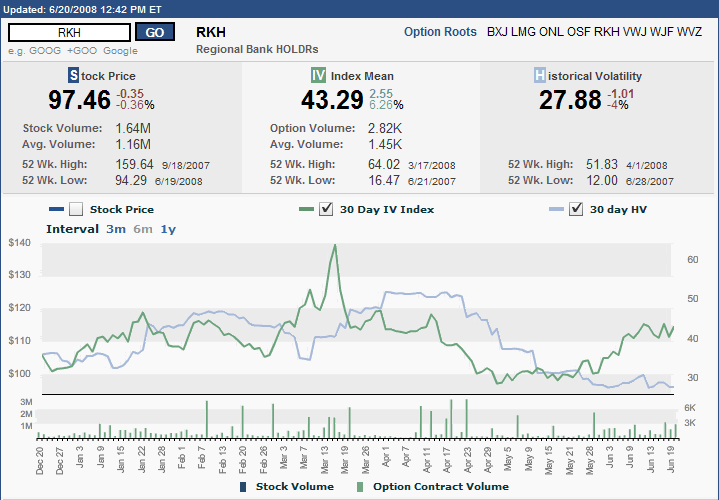
I am revisiting RKH today with a slightly different chart, also courtesy of the ISE, that compares RKH’s implied volatility and historical volatility over the past six months. In the chart below, notice that the implied volatility in this ETF has been more of an uptrend than the spike from mid-March. Notice also that implied volatility appears to have hit a plateau and is still far below the mid-March peak.
Also of interest, the gap between implied and historical volatility is at a six month high right now, as historical volatility has been trending down over the past three weeks at the same time implied volatility has been trending up.
Finally, note that in those instances where historical volatility has been elevated, it usually preceded a drop in implied volatility; conversely, where historical volatility has been depressed, this has a tendency to precede an uptick in volatility. Volatility extremes often signal turning points. Whether the current high implied volatility and low historical volatility means that the regional banks are finally bottoming remains to be seen, but I have to believe that the probability of a bottom is increasing with each volatile session.


6 comments:
Crash happens only when the market is oversold.
Hi there.
What's the software app that you are using to compare IV with HV as above?
Thanks
True, etrader. True.
Anon, it comes from the ISE's Quotes/Volatility page.
Etrader, did you mean overbought rather than oversold ?
Speaking of ISE, have you seen their new put/call data module? They have it on a couple of pages on their site, and it shows the number of calls and puts for what ISE's calculation considers to be the top bullish/bearish symbols:
http://www.ise.com/WebForm/viewPage.aspx?categoryId=126&header3=true&menu0=true
Thanks for that heads up.
The ISE's put to call data for individual stocks is a good teaser for their ISE Select offering. I haven't tried ISE Select yet, but it is on my list of services to try out in the coming months.
Cheers and good trading,
-Bill
Post a Comment