The VIX and Sectors: A One Day Snapshot
I collect a lot of strange and unusual data in the course of trying to be “Your One Stop VIX-Centric View of the Universe…” and it makes sense to share some of those chunks of data from time to time, even when I don’t think it will change the way anyone looks at the market.
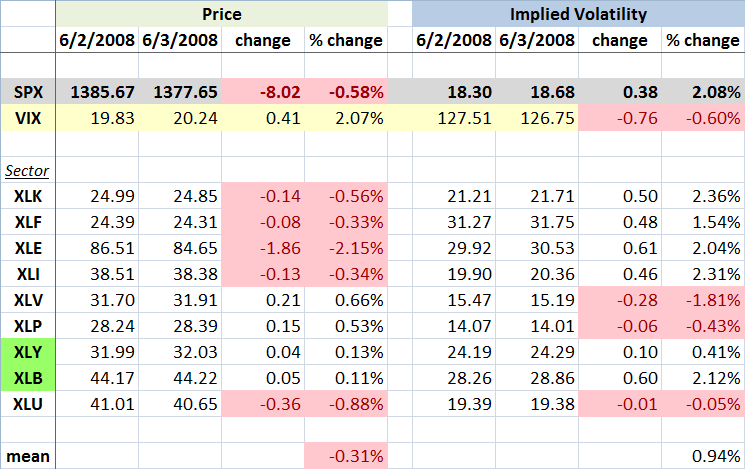
Now that I’ve lowered your expectations, I call your attention to the graphic below, which captures the movements in the various sector SPDRs over the course of Monday to Tuesday, a day in which rumors of persistent difficulties at Lehman Brothers (LEH) helped to drag down the financial sector ETF (XLF) to its lowest level since March. The sectors are ordered with the highest weighted ETF at the top (XLK - technology) and the lowest weighted (XLU - utilities) at the bottom. With any luck, the balance of the graphic is self-explanatory.
From a sector and volatility perspective, I found a few interesting tidbits from the graphic. First of all, the change in the VIX and the change in the SPX implied volatility were almost identical, which is what you would expect. I did find it interesting that the VIX jumped more than twice the percentage change in the mean IV across the nine sector ETFs. Drilling down a little more, only three of the sectors had an increase in IV that was higher than the jump in the VIX -- and in each instance this was just barely the case.
I have highlighted in green the two sectors in which the price of the ETF increased at the same time that implied volatility increased. For the consumer discretionary sector (XLY), the change is not particularly dramatic, but for the materials sector (XLB), there is a substantial jump in IV on the heels of increasing price. Needless to say, this is unusual.
Part of the explanation for the large increase in the VIX (and SPX IV) relative to the individual sectors may come from the fact that the four most heavily weighted sector ETFs all had a substantial rise in IV, but even when taking this into consideration, the change in the VIX exceeds the change in the sum of the weighted parts.
Finally, for anyone who followed my fearogram and SPX-VIX correlation analysis last year, you may recall that the median daily percentage move in the VIX is -4.2x of the daily move in the SPX. For the record, yesterday the VIX moved 3.6x in the opposite direction of the SPX. In percentage terms, this is a fairly typical negative daily correlation number. [Disclosure: Long LEH at time of writing.]


0 comments:
Post a Comment