Showing posts with label real estate. Show all posts

Friday, February 12, 2010

Greece or Chinese Real Estate?

A couple of days ago I posed the question, Are You Watching Greece? While I am certain that most investors are doing their best to keep on top of the latest news swirling around Greece and the European Union, the smaller question I addressed was which security or indicator would give a good glimpse into the status of the Greek problem.

While considerable attention is rightly being paid to Greece at the moment, one could easily argue that the increase in reserve requirement for Chinese banks is an equally large threat to global economic growth.

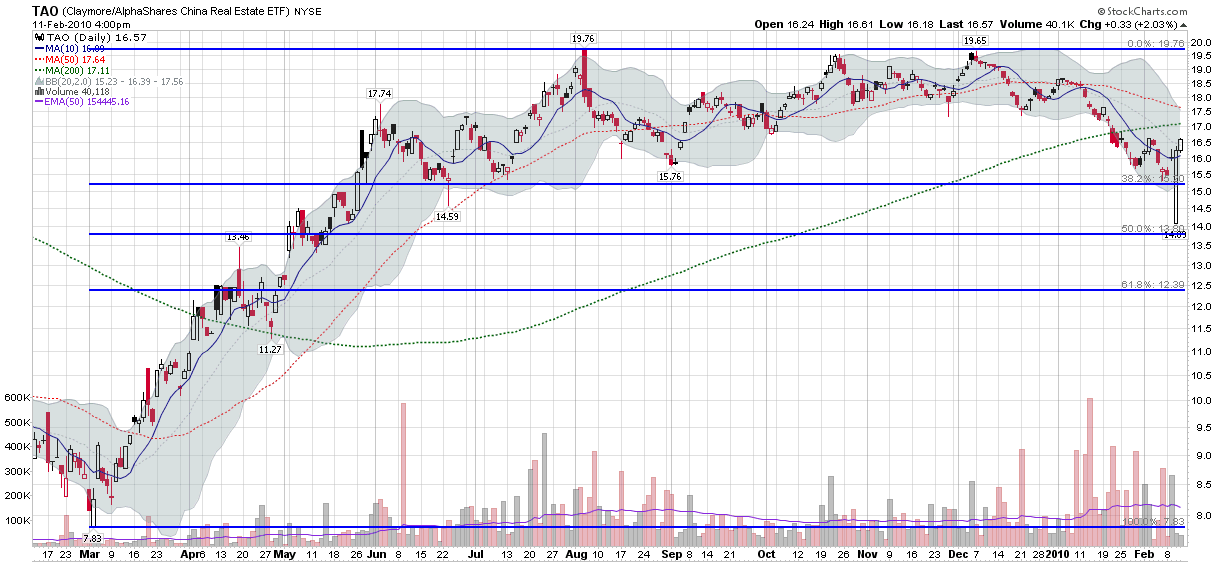
Unfortunately, good economic data is hard to come by in China, but with all the talk of a potential real estate bubble, investors should be focusing a good deal of their attention on Chinese real estate. The good news is that there is a Chinese real estate ETF that has a relatively long track record, good liquidity, and can serve as an excellent barometer for the real estate sector in China. Trading under the ticker TAO, the Claymore/AlphaShares China Real Estate ETF (holdings) includes REITs and publicly traded firms in the real estate sector in mainland China, Hong Kong and Macau.

The chart below captures of year of price action in TAO. Note that in the chart below, the long white candle from Wednesday is almost certainly the result of erroneous data. Excluding that bad print at the open, Friday’s low of 15.31 has all the appearances of at least a short-term cycle low.

At a minimum, investors should keep an eye on TAO. Beyond that, TAO is an excellent way for foreigners to speculate on Chinese real estate trends and/or hedge their portfolios accordingly.

For more on related subjects, readers are encouraged to check out:


[source: StockCharts]

Disclosures: long TAO at time of writing
Monday, August 10, 2009

The TAO of Chinese Real Estate

Two places where investors have done extremely well since March are China and real estate. Some investors have undoubtedly been lucky enough to find themselves at the intersection of these two bullish themes by being invested in Chinese real estate.

Historically, gaining significant exposure to Chinese real estate has been at best unwieldy for U.S. investors. In December 2007, however, investors were given a shortcut to Chinese real estate with the launch of the Claymore/AlphaShares China Real Estate ETF, which seeks to match the performance of the AlphaShares China Real Estate Index and sports the slightly-too-cute ticker TAO.

For about a year and a half, TAO received very little attention and struggled to put together an occasional 100,000 share day, but as Chinese stocks rebounded, TAO started gathering a following. For the last two months, volume in TAO has been improving and this formerly niche ETF has started to attract a mainstream following.

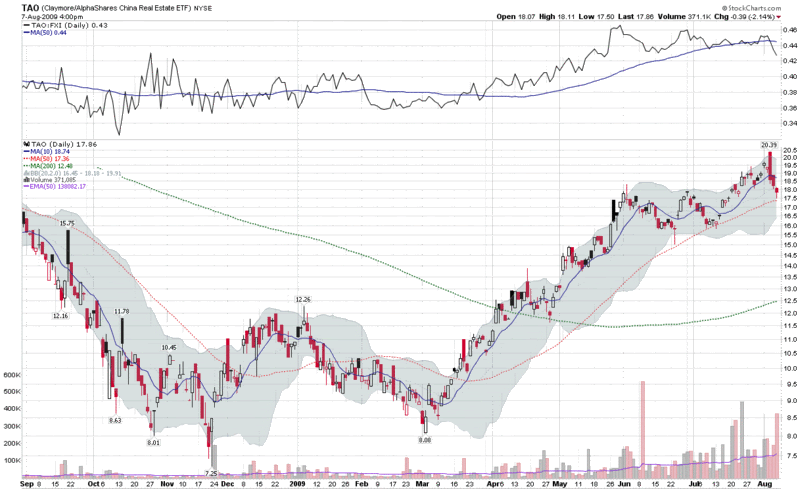
Last week, TAO peaked at 20.39, more than 2 ½ times the March low of 8.08. As the chart below shows, since last week’s high, TAO has begun to come under some selling pressure, both on an absolute basis and relative to FXI, the popular Chinese ETF (see top study.) Going forward, TAO is an interesting way to keep an eye on speculative trends in the Chinese real estate market.

Finally, don’t be surprised if Chinese securities start to exhibit more of a bellwether role for global securities.

[Thanks to Market Rewind for bringing TAO to my attention.]

[source: StockCharts]

Wednesday, August 5, 2009

Money Center Banks Surge as Regional Banks Lag

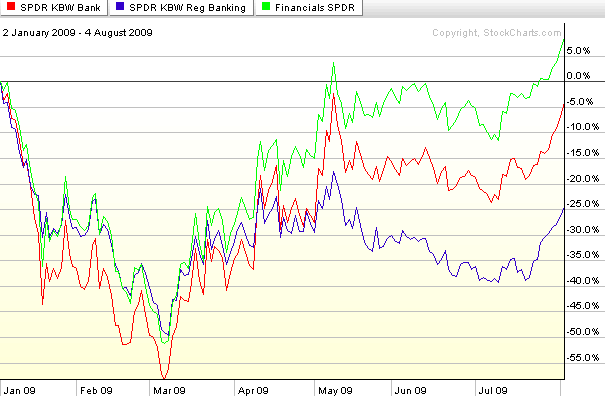
While the S&P 500 index is down about 0.8% as I type this, banks are faring considerably better than the index today, continuing a recent trend. Buying interest across the bank universe is splintered, however, with strong demand for money center banks and less interest in regional banks.

The chart below compares the performance of two popular banking ETFs, KBE, which is based on a broad-based bank index, and KRE, which is based on a regional banking index. The contrast is stark. Not only is KBE up 2.2% today while KRE is down a fractional amount, but this has been a recurring theme since the end of April, when regional banks became a laggard. Note that both banking ETFs have trailed the performance of the full financial sector, as represented by seemingly ubiquitous XLF.

During the last two days, sellers have been unable to put a dent in either real estate or financials. Until this pattern reverses, stocks are not going to be able to correct.

[source: StockCharts]

Tuesday, August 4, 2009

Real Estate Breaks Out While the Major Indices Pause

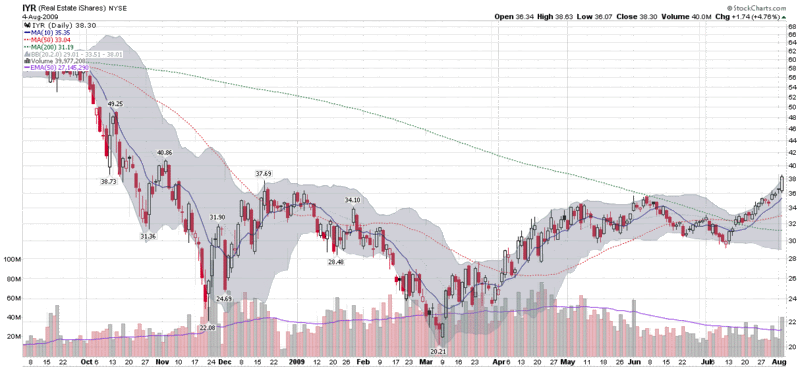
A wave of buying in the last ten minutes pushed the major indices to small gains today, following a day of lackluster trading. Stocks caught a bid early in the session following the announcement of a 3.6% increase in pending home sales for the month of June. While the broad indices bounced around near the unchanged mark all day, real estate was strong throughout the day, with IYR, the popular real estate ETF, gaining 4.8% on the day.

The chart below shows today’s action constituted a breakout for IYR, which is now trading at levels not seen since early November. Today’s volume of on volume of 40 million shares was also the highest in more than two months.

Three subsector real estate ETFs posted even more impressive gains than IYR. The FTSE NAREIT Retail Capped Index Fund (RTL) gained 6.0%, while the FTSE NAREIT Industrial/Office Capped Index Fund (FIO) advanced 5.5% and the FTSE NAREIT Residential Plus Capped Index Fund (REZ) added 4.9%. For more on the holdings of these three ETFs, check out Three Commercial Real Estate Sub-Sectors to Watch.


[source: StockCharts]

Monday, June 1, 2009

REITs and Retailers Leading Today’s Rally

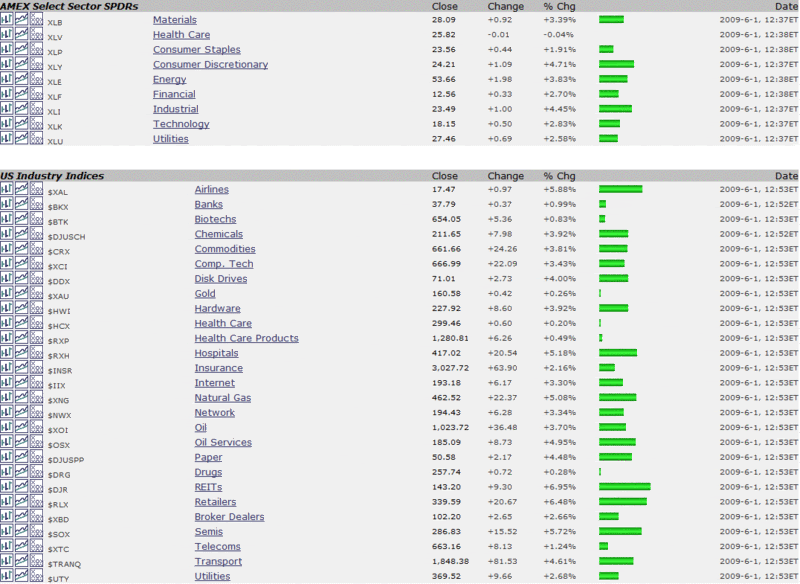
Below I have captured an excerpt of the excellent StockCharts Market Summary page, which provides a graphical and numerical overview of the day’s action across a wide variety of indices, sectors, geographies and asset classes.

Today I am focusing on the sectors that are leading the rally. These include REITs and retailers, with support from transports, including the air lines. Frankly, there is very little sector weakness across the board, just degrees of strength. While not shown in the graphic below, the yen is also doing well today.

I am somewhat skeptical that today’s rally will have legs, but as long as the breadth of the rally continues, the odds suggest that a reversal is not a high percentage play.

[source: StockCharts]

Wednesday, April 29, 2009

Three Commercial Real Estate Sub-Sector ETFs to Watch

I plead guilty to treating commercial real estate as a single homogeneous entity in my two previous commercial real estate posts, Commercial Real Estate Problems Piling Up and Moodys/REAL Commercial Property Price Index.

The truth is that while there are a wide variety of REITs out there that span the full range of commercial real estate activity, my focus is mainly on ETFs and when it comes to ETFs, most of the popular real estate ETFs are of the large catchall variety, such as IYR, ICF, VNQ and RWR.

While I am not aware of any ETFs that are pure plays on shopping center REITs, office REITs or apartment REITs, there are three commercial real estate sub-sector REIT ETFs that can help sort through various sectoral trends within the REIT universe. The three sub-sector ETFs, with their allocations as of April 28th are as follows:

FTSE NAREIT Retail Capped Index Fund (RTL)

  • 52.28% Equity Shopping Centers
  • 35.85% Equity Regional Malls
  • 11.47% Equity Free Standing
  • 0.20% Short-Term Securities

FTSE NAREIT Industrial/Office Capped Index Fund (FIO)

  • 54.87% Equity Office
  • 26.92% Equity Industrial
  • 17.93% Equity Mixed

FTSE NAREIT Residential Plus Capped Index Fund (REZ)

  • 41.98% Equity Apartments
  • 39.02% Equity Health Care
  • 15.35% Equity Self Storage
  • 3.37% Equity Manufactured Homes
  • 0.07% Short-Term Securities

For the record, the limited liquidity for RTL and FIO makes them better indicators than trading vehicles, but REZ is actively traded.

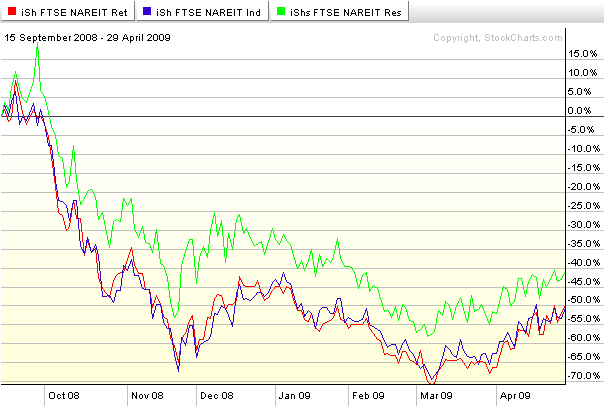
As the chart below shows, the retail and industrial/office REIT ETFs have moved almost in lockstep in the post-Lehman world, while the residential ETF fared better in the downturn, but has been a little more sluggish during the bounce off of the March bottom.

[source: StockCharts.com]

Thursday, August 7, 2008

Weak Bounce in Homebuilders

Pending home sales are up 5.3% today, handily beating the consensus expectations, which called for a 1.0% decline. Barry Ritholtz at The Big Picture has a different interpretation of the data in Media Gets Pending Home Sales Wrong (Again!) Not surprisingly, Barry is less optimistic about the state of the housing market and emphasizes the importance of looking at year over year changes instead of sequential monthly changes.

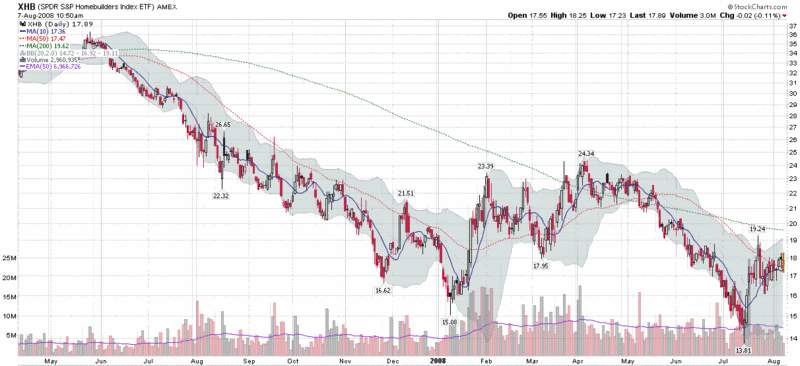
The homebuilders are a very interesting sector – and one worth following closely. Homebuilder stocks (as measured by the XHB ETF) actually peaked at 39.39 back in early February 2007, several months prior to the time frame covered in the chart below.

For a few months, homebuilders looked as if they had made a bottom in January, when they rallied more than 60% from their January low to their April high, only to grind down to a new bottom in July. The graphic shows a sharp two day bounce off of the July low, followed by a lot of sideways action over the course of the past three weeks. At this stage, the July bottom does not yet look convincing and XHB is actually trading down as I type this.

With foreclosure activity now accounting for an increasingly large percentage of all home sales, statistics such as selling price per square foot (see Solano County, in particular) may help to sort out some of the divergence between sales volume and sales price data.

Friday, December 14, 2007

Neighborhood Home Values Holding Up Nicely

A month ago, in The Other Bubble, I mentioned that I live in Marin County, just north of San Francisco and commented on the surprising strength of the local real estate market. Well, things appear to be better than I thought.

Amidst all the talk of the subprime meltdown and impending financial calamities, I found it interesting that not too far from where I live, a house has apparently just gone into contract for $65 million – the full asking price. The Wall Street Journal broke the story this morning, but an old Forbes profile of The Most Expensive House in California is a better stop to read more about Locksley Hall, currently owned by Robert “Toxic Bob” Friedland, a global mining tycoon who earned his nickname by helping to turn Summitville Mine into one of the most notorious Superfund sites.

While I mentioned on Wednesday that I have had a good run with my trading lately, I hasten to add that I am not the buyer. So far, the buyer's name has not been disclosed. One locally famous name worth noting, however, is Olivia Hsu Decker, who handled the listing and whose web site makes for interesting browsing if you are into house envy.

Friedland has renovated the original house extensively and various sources list the current square footage at 10,000 or 12,000. I must say, however, that $6,000 per square foot is not outrageous for the area, especially considering that the views from the site are generally considered to be in the top five in the world.

If nothing else, this transaction will make for some interesting average home sale price statistics in the area. Perhaps some day I can try to sneak it in as a comp...

Thursday, November 15, 2007

The Other Bubble

I have visited 47 states (all except North Dakota, Arkansas and Oklahoma) and seen a lot more of this country than most will ever see, so when I look at the various foreclosure and subprime maps that have been making the rounds lately, it is easy for me to picture many of these places and the residents I have met there along the way.
On the other hand, I live just north of San Francisco in Marin County, which in many ways, is like living in a completely different kind of bubble in terms of real estate values, disposable income, attitudes, politics, etc. When it comes to real estate in the area, starter homes in the $3 million range are not uncommon. For some additional context, a couple of years ago my wife and I looked at a local $8.5 million house that lacked a private master bedroom and was in need of a fair amount in the way of repairs.

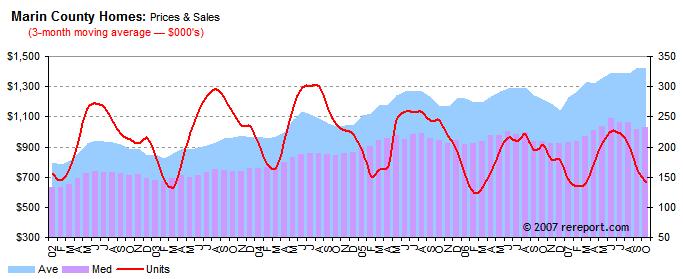
In spite of the projections by the Marin Real Estate Bubble blog, local real estate has been surprisingly resilient. The Marin Real Estate Report tracks a variety of real estate data and is the source of the graphic below, which shows that for the past seven years, real estate has climbed fairly steadily, at least when adjusted for seasonal trends. The story is different in other parts of California, as comparable San Diego data show, but for now at least, the full extent of the Marin bubble seems to be intact.

DISCLAIMER: "VIX®" is a trademark of Chicago Board Options Exchange, Incorporated. Chicago Board Options Exchange, Incorporated is not affiliated with this website or this website's owner's or operators. CBOE assumes no responsibility for the accuracy or completeness or any other aspect of any content posted on this website by its operator or any third party. All content on this site is provided for informational and entertainment purposes only and is not intended as advice to buy or sell any securities. Stocks are difficult to trade; options are even harder. When it comes to VIX derivatives, don't fall into the trap of thinking that just because you can ride a horse, you can ride an alligator. Please do your own homework and accept full responsibility for any investment decisions you make. No content on this site can be used for commercial purposes without the prior written permission of the author. Copyright © 2007-2023 Bill Luby. All rights reserved.
 
Web Analytics