Showing posts with label commercial real estate. Show all posts

Thursday, October 7, 2010

The REZ Paradox

I had a brief exchange with Andrew Butter on Seeking Alpha that I thought might warrant a broader audience here.

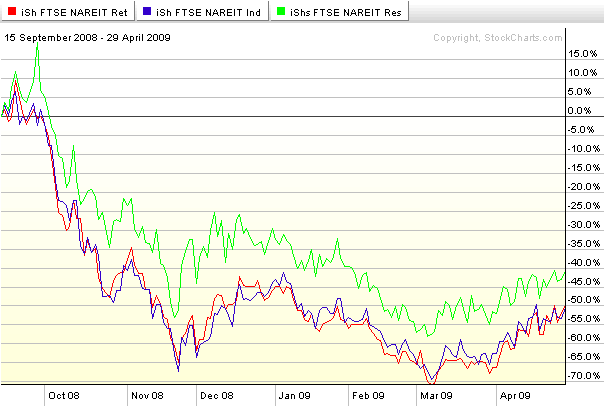
Specifically, Andrew asked about the FTSE NAREIT Residential Plus Capped Index Fund (REZ) and wondered if apartments were behind the relative outperformance of this real estate ETF.
My reply noted that the three largest components of REZ are:

  1. Apartments – 47%
  2. Health care – 37%
  3. Self storage – 13%
It comes as no surprise to anyone that recent economic forces have driven a number of strong housing market trends, including a decrease in home ownership and an increase in the demand for apartments. A story by Dawn Wotapka of the Wall Street Journal yesterday confirmed that the apartment market continues to rally.

Of course, as homeowners migrate to apartments, they are typically downsizing in terms of square feet of living space, which is also increasing the demand for self-storage facilities. When you add together the 47% of REZ that is accounted for by apartments and 13% that is attributed to self storage, the result of the move from homes to apartments is a paradox of sorts in which the REZ ETF as currently structured should perform particularly well in a deteriorating residential real estate market.

Seen in this light, there is little wonder that REZ has outperformed its counterparts, RTL and FIO, which are focused primarily on shopping centers and offices, respectively.

Finally, on a housekeeping note, I am making a concerted effort to keep up with my Seeking Alpha private mailbox and comments, just as I do with private emails and comments on the blog. At the moment I am a little behind, but if you have some outstanding questions and comments, I expect to get caught up in the next day or two.

Related posts:

Disclosure(s): none

Wednesday, October 6, 2010

Commercial Real Estate Sub-Sector Breakout

Back in April 2009 in Commercial Real Estate Sub-Sectors ETF to Watch, I highlighted three commercial real estate sub-sector REIT ETFs, discussed their composition and included a performance graph going back to the date of the Lehman Brothers bankruptcy, September 15, 2008. The three REIT ETFs are:

  • FTSE NAREIT Retail Capped Index Fund (RTL) – emphasis on shopping centers (46%) and regional malls (43%)
  • FTSE NAREIT Industrial/Office Capped Index Fund (FIO) – mostly office (66%), but some (21%) industrial
  • FTSE NAREIT Residential Plus Capped Index Fund (REZ) – apartments (47%) dominate, but with a healthy dose (37%) of health care
I have updated the performance of each of these real estate sectors in the chart below, which reflects all dividends and also begins from the date of the Lehman Brothers bankruptcy filing. This time around, instead of updating the StockCharts.com graphic, I have elected to use an ETFreplay.com chart, as it adds some numbers to the chart, notably total return statistics as well as historical volatility and drawdown data.

Note that the residential real estate ETF, REZ, has rallied to where it is currently trading 8.1% above its pre-Lehman level and comfortably above the April 2010 high. On the other hand, the highly correlated industrial/office real estate ETF (FIO) and retail real estate ETF (RTL) are still both more than 15% below their pre-Lehman levels and are struggling to move above their April 2010 highs.

Real estate is a multi-dimensional beast and these three sub-sector ETFs can assist investors in understanding which parts of the real estate market are showing relative strength and which are demonstrating relative weakness.

Related posts:

[source: ETFreplay.com]

Disclosure(s): none

Tuesday, October 5, 2010

Updating the Commercial Real Estate Picture

I am amazed by how many people land on this blog via Google and other search engines in the process of looking for answers to various questions about commercial real estate. I find this interesting in that I have only tagged six posts with the CRE label (the links at the bottom of this post) and none in the past 17 months. Obviously there are a lot of people with questions and very little in the way of answers.

One of the CRE subjects I touched upon in April 2009 was the Moodys/REAL Commercial Property Price Index. According to the MIT Center for Real Estate, the CPPI “is designed to track same-property realized round-trip price changes based purely on the documented prices in completed, contemporary property transactions. The index uses no appraisal valuations.” There are actually a number of indices and sub-indices in the CPPI. I have reproduced the monthly national index below, which aggregates data from each of the four major property type sectors (office, apartment, industrial and retail) across a broad cross-section of metropolitan areas. Sub-indices track trends in different sectors and in different geographies.

Note that in the national index graph below, the bounce in the index from earlier in the year has been reversing since April. Looking at the sectors (not shown), the only area of continued strength in the commercial real estate market has been apartments. The office sector is rebounding weakly, the industrial sector appears to be wavering and the retail sector continues to decline sharply.

Going forward, I intend to feature more posts on the commercial real estate market.

For those looking for a more regular flow of content from industry insiders, check out a list I compiled last year of my favorite Commercial Real Estate Blogs.

Related posts:


[source: MIT Center for Real Estate, Real Capital Analytics]

Disclosure(s): none

Friday, May 1, 2009

The Looming Commercial Real Estate Crisis

I was going to set aside the subject of commercial real estate for now, but it just so happens that Kevin Hall at McClatchy has penned a superb overview of the potential problems in this area in Next Economic Crisis Looms: Commercial Real Estate Defaults. (Hat tip, Deal Junkie)

Rather than providing some snippets from the McClatchy piece, I recommend that readers click through to read the entire article.

Thursday, April 30, 2009

Commercial Real Estate Blogs

Since I have been beating the commercial real estate drum for the past week or so and plan to move on to other topics, I think it is only appropriate to pay homage to some of the blogs that tackle CRE on a full-time basis.

Frankly, the pickings are slimmer when it comes to commercial real estate blogs than residential real estate blogs, but there are still quite a few excellent sources of information. Three of my favorites are Deal Junkie, Llenrock and Real Property Alpha.

A broader list of some commercial real estate blogs worth checking out includes the following:

Wednesday, April 29, 2009

Three Commercial Real Estate Sub-Sector ETFs to Watch

I plead guilty to treating commercial real estate as a single homogeneous entity in my two previous commercial real estate posts, Commercial Real Estate Problems Piling Up and Moodys/REAL Commercial Property Price Index.

The truth is that while there are a wide variety of REITs out there that span the full range of commercial real estate activity, my focus is mainly on ETFs and when it comes to ETFs, most of the popular real estate ETFs are of the large catchall variety, such as IYR, ICF, VNQ and RWR.

While I am not aware of any ETFs that are pure plays on shopping center REITs, office REITs or apartment REITs, there are three commercial real estate sub-sector REIT ETFs that can help sort through various sectoral trends within the REIT universe. The three sub-sector ETFs, with their allocations as of April 28th are as follows:

FTSE NAREIT Retail Capped Index Fund (RTL)

  • 52.28% Equity Shopping Centers
  • 35.85% Equity Regional Malls
  • 11.47% Equity Free Standing
  • 0.20% Short-Term Securities

FTSE NAREIT Industrial/Office Capped Index Fund (FIO)

  • 54.87% Equity Office
  • 26.92% Equity Industrial
  • 17.93% Equity Mixed

FTSE NAREIT Residential Plus Capped Index Fund (REZ)

  • 41.98% Equity Apartments
  • 39.02% Equity Health Care
  • 15.35% Equity Self Storage
  • 3.37% Equity Manufactured Homes
  • 0.07% Short-Term Securities

For the record, the limited liquidity for RTL and FIO makes them better indicators than trading vehicles, but REZ is actively traded.

As the chart below shows, the retail and industrial/office REIT ETFs have moved almost in lockstep in the post-Lehman world, while the residential ETF fared better in the downturn, but has been a little more sluggish during the bounce off of the March bottom.

[source: StockCharts.com]

Moodys/REAL Commercial Property Price Index

Last week, in Commercial Real Estate Problems Piling Up, I opined that commercial real estate is a likely candidate to usher in the next leg of the financial crisis. Since the S&P/Case-Shiller Home Price Index gets so much publicity, I thought this would be a good opportunity to mention a commercial real estate index that deserves more attention: the Moodys/REAL Commercial Property Price Index.

This index was last updated April 24th and shows that prices have dropped slightly more than 20% since the October 2007 peak.

While residential prices are important to watch, most of the residential story has already been told. The rest of the real estate story – good or bad – likely lies on the commercial side.

[source: MIT Center for Real Estate, Real Capital Analytics]

Monday, April 20, 2009

Commercial Real Estate Problems Piling Up

Though it gets little in the way of airplay on the blog, real estate happens to be one of my favorite asset classes. It is volatile, can be highly leveraged and also provides what I call “use value,” meaning that it is not necessarily just a piece of paper you hope will appreciate, but can also be tangible property that you can get some enjoyment out of. For the same reason, I would much rather have a Miró hanging on my wall than an investment in an art ETF.

Getting back to real estate, I theorized in Waiting for the Next Shoe to Drop that either credit card debt or commercial real estate would be the most likely candidates to usher in the next leg of the financial crisis.

Moody’s recently reported that the U.S. credit card charge-off rate rose to a record 8.82% in February and noted that they expect charge-offs to hit a peak of 10.5% during the first half of 2010.

The ticking bomb of commercial real estate may have even more severe consequences as commercial real estate prices continue down over the course of the next few years. A week ago, Fil Zucchi did an excellent job of explaining the problems in commercial real estate at Minyanville in A Commercial Real Estate Comeback? and today he is back with a follow-up piece, Ten Reasons Why Commercial Real Estate Won’t Rebound.

There are many ways to play real estate. The double ETFs, URE (+2x) and SRS (-2x) are a good place to look for trading vehicles. For non-leveraged plays, IYR offers the best liquidity and an active options market to boot. Given the strength of the recent bounce in real estate stocks (more than 50% off of the recent bottom, as the chart below shows), I would favor the short side at least until I get a better sense of how the commercial real estate story will unfold.

[source: StockCharts]

Disclosure: Short IYR at time of writing.

Wednesday, April 8, 2009

Waiting for the Next Shoe to Drop?

There has been a lot of speculation about which corner of the economy is likely to implode next and start to write the next chapter in the current financial crisis. Credit card debt and commercial real estate are two of the most frequently cited potential culprits, but lately Eastern European banks have been under great stress, while credit default swaps for Romania, Bulgaria and Hungary have been on the rise.

I did not realize how strong the undercurrent of fear was until I ran Today’s Jump in the VIX on Monday evening. From the various public and private comments, it is clear that there is a strong contingent of veteran investors who anticipate not only that the next shoe will drop soon, but that the fallout will be at least as bad as what we experienced during the October-November peak of the crisis.

While I am not ruling out anything at this stage, I do not see the VIX spiking above 60 in the near future, nor do I even see a VIX above 50 as a likely scenario.

Last Friday, the SPX had its highest close since the 666.79 “devil’s bottom” low of March 6th. From Friday’s 842.50 close to Tuesday’s close of 815.55, the SPX fell 3.2%. During this same period, the cash VIX gained just 1.7%, moving up from 39.70 to 40.39. In the chart below, however, one can see that even thought the cash VIX rose, the volatility index for SPX options in April, May, June, July and September actually fell, with volatility for the April expiration showing a 12.5% drop in the VIX, May volatility dropping 4% and the June through September strikes show a volatility decrease on the order of 0.9%-1.6%. In other words, expectations for volatility – and presumably fear and uncertainty – for the balance of the year continue to point to improvement.

Of course, there is always a group of traders who get fearful when the VIX fails to measure what they believe is an appropriate level of fear. This group, whose concern I can sympathize with from time to time, will undoubtedly see an indifferent VIX as a reason to be even more concerned about the future.

For now at least, the VIX term structure points to increasing investor confidence in the markets and a decreasing concern about the possibility of gravity commingling ominously with oversized footwear.

[source: CBOE, VIXandMore]

DISCLAIMER: "VIX®" is a trademark of Chicago Board Options Exchange, Incorporated. Chicago Board Options Exchange, Incorporated is not affiliated with this website or this website's owner's or operators. CBOE assumes no responsibility for the accuracy or completeness or any other aspect of any content posted on this website by its operator or any third party. All content on this site is provided for informational and entertainment purposes only and is not intended as advice to buy or sell any securities. Stocks are difficult to trade; options are even harder. When it comes to VIX derivatives, don't fall into the trap of thinking that just because you can ride a horse, you can ride an alligator. Please do your own homework and accept full responsibility for any investment decisions you make. No content on this site can be used for commercial purposes without the prior written permission of the author. Copyright © 2007-2023 Bill Luby. All rights reserved.
 
Web Analytics