Showing posts with label XHB. Show all posts

Sunday, November 15, 2009

Chart of the Week: Four Key Sectors Struggle

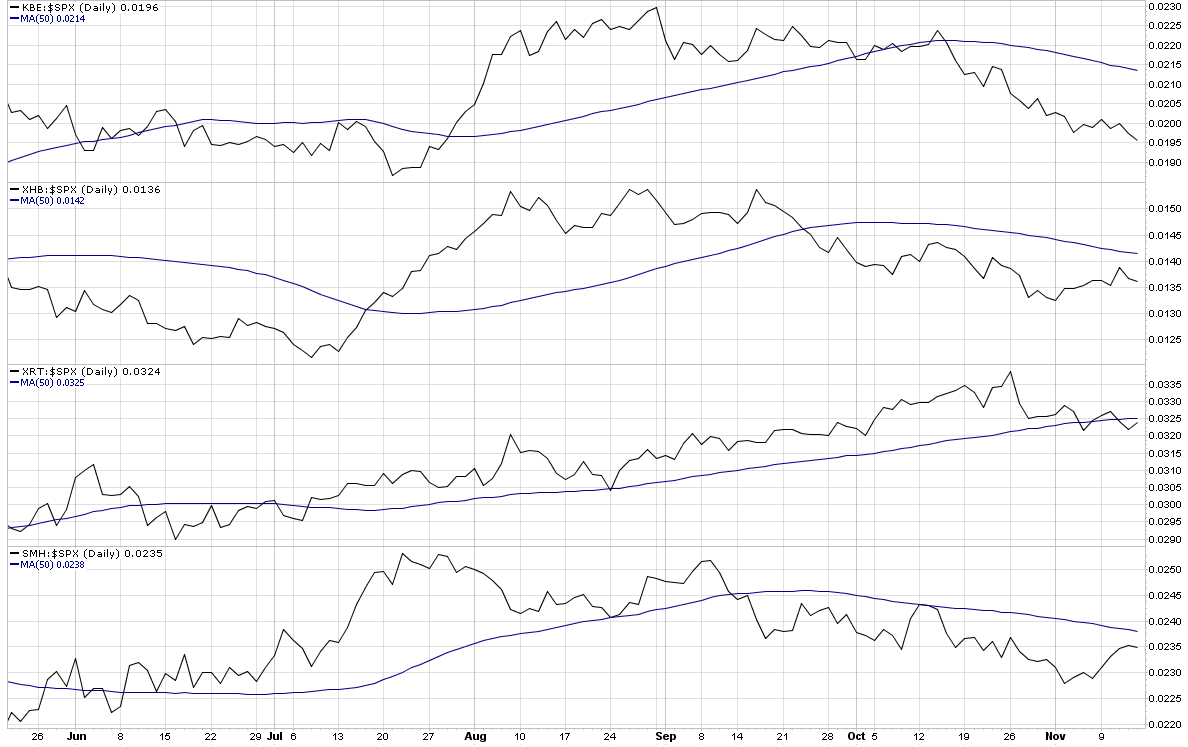
While I still have at least one and a half feet placed firmly in the bull camp, I am increasingly concerned with a number of signs from some key technical indicators. Near the top of my list of concerns is market breadth, as measured by the McClellan Summation Index and other similar market breadth indicators. The bottom line is that if the indices continue to advance on the strength of a narrow base of rising stocks while the majority of issues move sideways or decline, then the rally will have trouble sustaining itself.

During the last few weeks, several key sectors have been underperforming the S&P 500 index, notably banks (KBE); homebuilders (XHB); retailers (XRT); and semiconductors (SMH). This week’s chart of the week shows the performance of the four sectors relative to the S&P 500 index over the course of the last six months. In all four instances, these critical sectors are below the 50 day average of their ratio to the SPX and in the case of the banks, the relative performance gap is increasing almost on a daily basis.

Going forward, I would expect that the major market indices such as the SPX will have difficulty making new highs if all four of these sectors continue to underperform on a relative basis. For this reason, I will keep an eye generally on market breadth and specifically on these four key sectors.

For additional posts on related subjects, readers are encouraged to check out:

[source: StockCharts]

Friday, April 24, 2009

XLY and XHB Move Above 200 Day Moving Averages

Two important ETFs, XLY (consumer discretionary) and XHB (homebuilders) have moved above their 200 day simple moving averages today for the first time since early October.

Among other important indices and ETFs that are closing in on their 200 day SMAs are the NASDAQ-100 index (NDX), semiconductor index (SOX) and emerging markets ETF (EEM).

If the current bullishness holds, we may see widespread moves above the 200 day SMA – and the possibility of renewed buying interest…or an opportunity to take profits.

I am cautious as the SPX approaches 875, but am not interested in a substantial short position until there is some sort of bearish momentum.

Thursday, December 11, 2008

Where Is the Leadership in this Rally?

For the last three weeks, I have been impressed by the confidence and resolve shown by the bulls as they have consistently used pullbacks to flood the market with new long positions. Perhaps algorithms have no fear

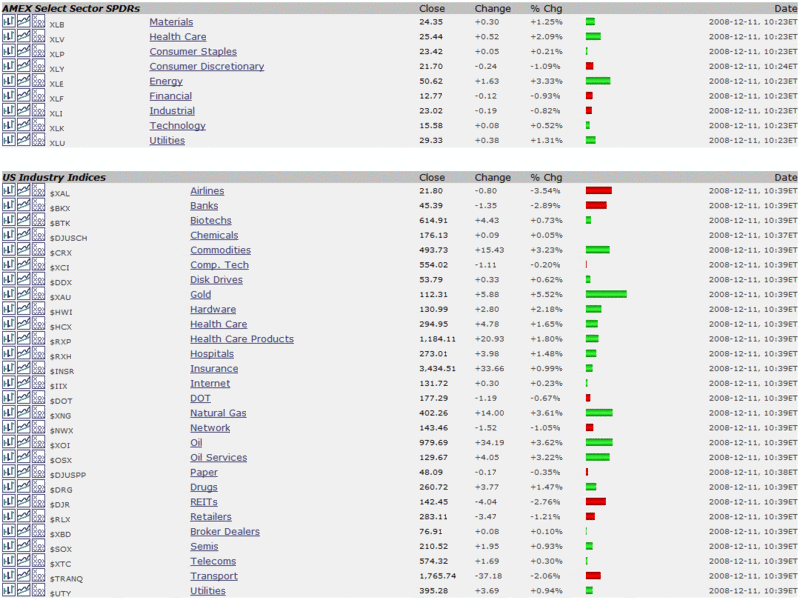
More recently, however, as the bull leg has stalled around the SPX 900 mark, I have found myself thinking about the lack of ‘proper’ leadership. Yesterday and today, the rallies have been led by commodities, with gold and energy equities the top performers.

At the same time, the three sectors I think are most critical to the recovery, my so-called ‘indicator species’ sectors (financials, homebuilders and consumer discretionary stocks), have been unable to get out of the red today.

I am not sure where the leadership will come from that will eventually push the SPX back over 1000. Today large cap technology names First Solar (FSLR), Apple (AAPL), Dell (DELL), Research in Motion (RIMM), eBay (EBAY) and Intel (INTC) are all strong performers. Frankly, I would expect technology to play a strong role in the next big leg up, but leadership may come from a number of other sectors.

There are few guarantees in the stock market, but I can guarantee that gold and energy are not going to pull the SPX up over the 1000 mark and leave financials (XLF), homebuilders (XHB), and consumer discretionary stocks (XLY) behind.

[source: StockCharts]

Friday, December 5, 2008

Breaking Down the Financial Sector Post-Lehman

For most of 2008, the three sectors I have been watching most closely to gauge the health of the economy are financials (XLF), homebuilders (XHB), and consumer discretionary stocks (XLY). I have even referred to these sectors as my ‘indicator species’ sectors, as I am of the opinion that unless all three of these sectors are healthy, the health of the broader economy cannot be assured.

In the past two weeks, relative strength all three of the above sectors has helped the broader market indices put in what is no less than a provisional bottom. Financials have been the most consistently strong sector, with the XLF financial ETF now 35% above its November 21st low.

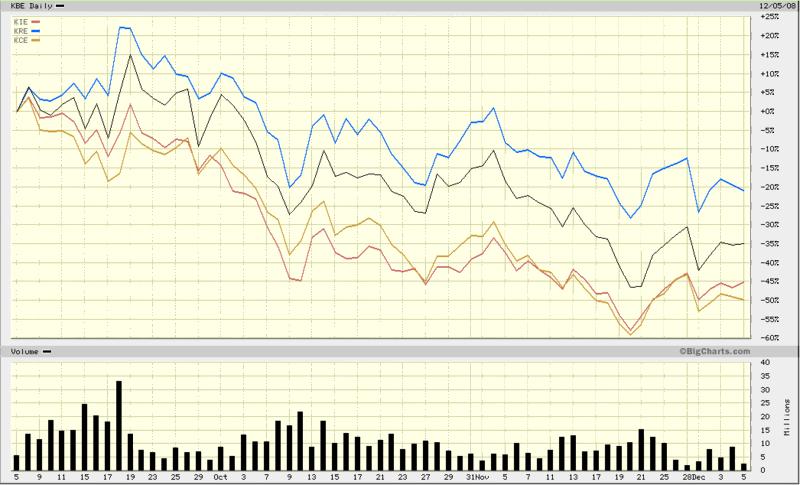
In the chart below, I have attempted to break out the relative performance of various financial sectors over the past three months, using four ETF from the financial sector specialist Keefe, Bruyette & Woods (KBW). The chart dates back to September 5th, ten days before the Lehman Brothers bankruptcy. The baseline ETF (black line) is KBE, which tracks the KBW bank index. The top performer among the other three ETFs is KRE, the KBW regional banking index. The two laggards are KIE (KBW insurance index) and bottom-dweller KCE (KBW capital markets index.)

In relative terms, insurance and capital markets seem to have enjoyed the more impressive bounce off of the November low. Regional banks, which actually showed small gains in September, have been acting more sluggish as of late. More dominoes are certain to topple as the ripple of the financial crisis continues to broaden its reach, but the recent relative strength in insurers and investment banks bodes well for the financial sector, which just might provide leadership when the next bull leg commences.

[source: BigCharts]

Monday, November 17, 2008

The Big Four U.S. Banks

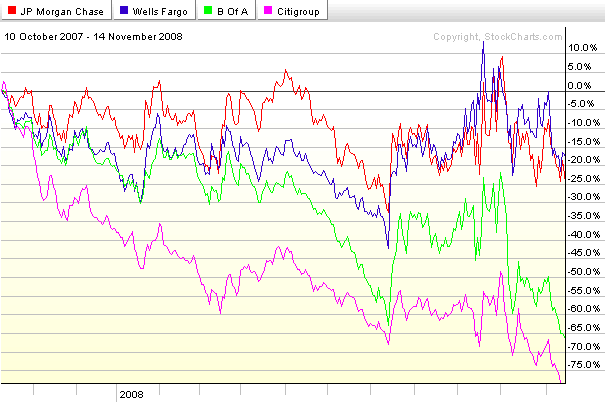
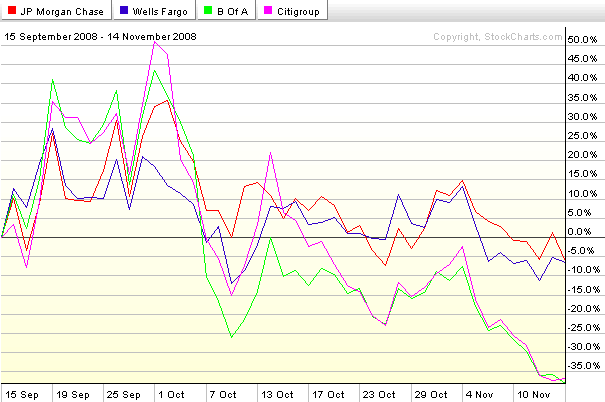
The events of 2008 have completely reshaped the landscape of the U.S. commercial banking industry. At this point it looks as if four major banks will emerge as the dominant players: two relatively strong ones; and two that face a more challenging competitive environment. Here the charts identify the players nicely. From the peak of October 2007, Wells Fargo (WFC) and JPMorgan Chase (JPM) have each fallen about 20%, less than one half of the drop in the financial sector ETF, XLF. At the other end of the spectrum are Bank of America (BAC) and Citigroup (C), each of which has seen their stock drop at least 65% during this period. See the top chart for details. Refocus to the period since the failure of Bear Stearns (bottom chart) and the pattern is even more dramatic, with WFC and JPM each down a little more than 5% while BAC and C are down over 35%.

XLF made a new low of 11.70 on Thursday and is trading at about 12.00 as I type this. If XLF and the large commercial banks are not able to scrape out a bottom, then this market will not be able to sustain any rally. Better yet, add XHB (homebuilders) and XLY (consumer discretionary sector) to that list. A sustainable rally will require the participation of XLF, XHB, and XLY.

[source: StockCharts]

Thursday, August 7, 2008

Weak Bounce in Homebuilders

Pending home sales are up 5.3% today, handily beating the consensus expectations, which called for a 1.0% decline. Barry Ritholtz at The Big Picture has a different interpretation of the data in Media Gets Pending Home Sales Wrong (Again!) Not surprisingly, Barry is less optimistic about the state of the housing market and emphasizes the importance of looking at year over year changes instead of sequential monthly changes.

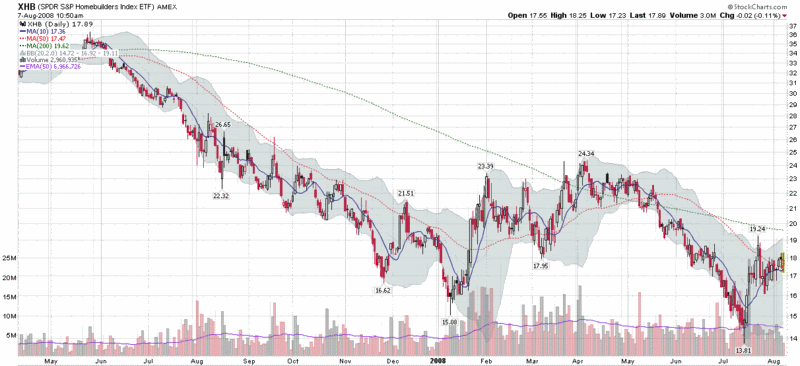
The homebuilders are a very interesting sector – and one worth following closely. Homebuilder stocks (as measured by the XHB ETF) actually peaked at 39.39 back in early February 2007, several months prior to the time frame covered in the chart below.

For a few months, homebuilders looked as if they had made a bottom in January, when they rallied more than 60% from their January low to their April high, only to grind down to a new bottom in July. The graphic shows a sharp two day bounce off of the July low, followed by a lot of sideways action over the course of the past three weeks. At this stage, the July bottom does not yet look convincing and XHB is actually trading down as I type this.

With foreclosure activity now accounting for an increasingly large percentage of all home sales, statistics such as selling price per square foot (see Solano County, in particular) may help to sort out some of the divergence between sales volume and sales price data.

Monday, July 28, 2008

Bullish Case Losing Traction

As this week is somewhat of a vacation for me, I had a rare day where I missed about 95% of the trading action and am only now checking the patient’s vital signs. On a down day like today, I expect to see some more bullish bias creep into some of my contrarian sentiment indicators; much to my surprise, today things actually look worse for the bulls in that regard.

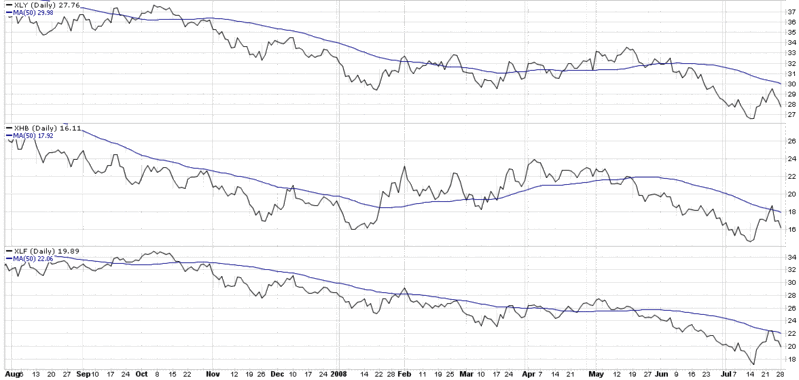
Now that it has been more than two months since I posted the chart below, I thought this evening might be a good time to update the three sectors I have been watching most closely since the March bottom. These 'indicator species' sectors are the financials (XLF), homebuilders (XHB), and consumer discretionary (XLY) stocks. As the chart shows, the financials and homebuilders recently moved above their 50 day simple moving average, only to fall sharply below that important technical level over the course of the past three days.

Until the XLF, XHB, and XLY can all close above their 50 day simple moving averages, I am likely to be skeptical of anything that has the appearance of a rally.

Tuesday, May 20, 2008

Three Pivotal Sectors: Financials; Homebuilders; and Consumer Discretionary

Throughout the recent market turmoil, there have been three sectors that I have watched most closely in order to help determine the extent of the challenges the US economy is currently facing and will face in the near future. There should be no surprises here, but for the record, those sectors are financials (XLF), homebuilders (XHB), and consumer discretionary (XLY).

The financials are the foundation of these three sectors and provide a sense of the strength of the institutions involved in credit markets and other related financial businesses. The homebuilders offer some insight into changes in value of existing real estate assets, as well as consumer confidence and willingness to undertake large financial commitments in the coming months. Finally, consumer discretionary firms reflect the size of the pool of disposable income and the level of comfort consumers have in letting go of or holding on to that money.

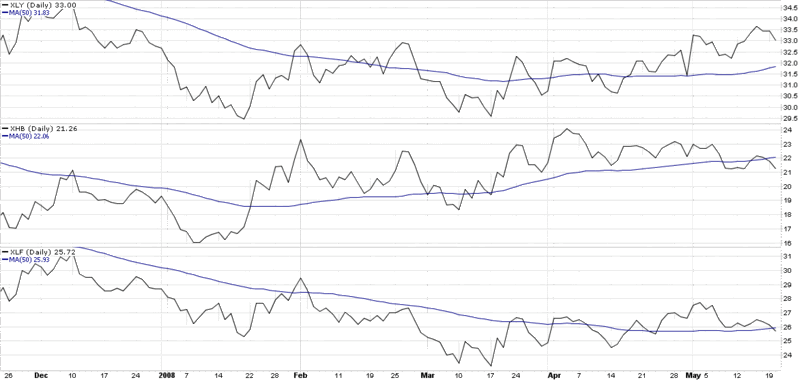
The chart below shows all three sectors over the past six months. Financials and homebuilders are clearly struggling and have both fallen below their 50 day simple moving averages as of late. The consumer discretionary sector has been the strongest of the three over the past month, but may have peaked last week after getting extended.

Ultimately, my belief is that a healthy economy and a healthy stock market require a strong performance in all three of these pivotal sectors, which is why I call them my 'indicator species' sectors. That may still happen down the road, but at the moment, at least two of the three pivotal sectors are showing a fair amount of weakness.

Tuesday, March 25, 2008

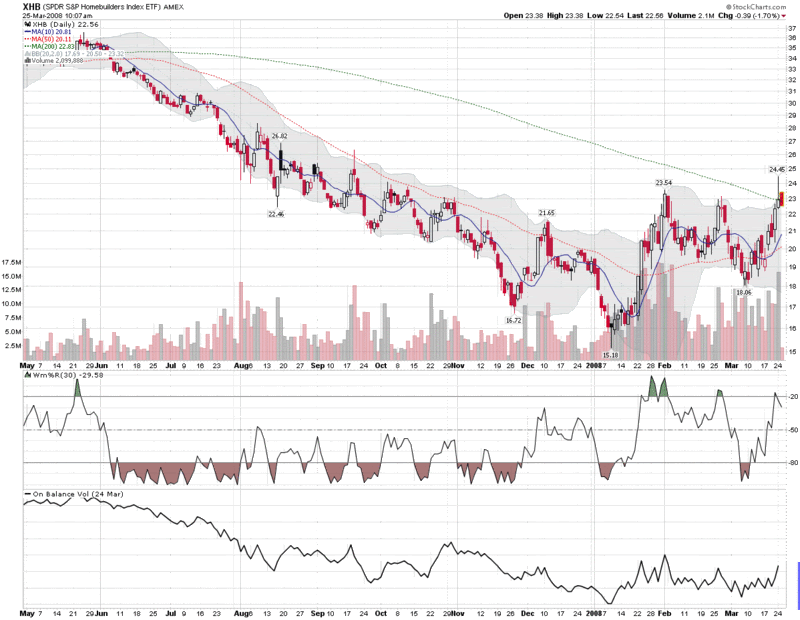
Rally in the Homebuilders

Yesterday I offered up two charts which suggested that investment banks probably put in a bottom last week.

Today I turn my attention to the homebuilders. In the chart of the SPDR Homebuilders ETF below, it appears highly likely that the early January low of 15.18 will be the ultimate low for the cycle, as the index has already climbed over 50% from that level. In fact, yesterday’s intra-day high of 24.45 was the highest this index has traded since September 2007. As the index moves over its 200 day simple moving average for the first time in ten months and shows a sharp upturn in on balance volume, technical signals should continue to improve.

This is not to say, of course, that the homebuilders will move straight up from here. Nevertheless, as the investment banks and homebuilders move off of their recent bottoms, the large amount of cash in money market funds will undoubtedly become less anxious about returning to equities.

DISCLAIMER: "VIX®" is a trademark of Chicago Board Options Exchange, Incorporated. Chicago Board Options Exchange, Incorporated is not affiliated with this website or this website's owner's or operators. CBOE assumes no responsibility for the accuracy or completeness or any other aspect of any content posted on this website by its operator or any third party. All content on this site is provided for informational and entertainment purposes only and is not intended as advice to buy or sell any securities. Stocks are difficult to trade; options are even harder. When it comes to VIX derivatives, don't fall into the trap of thinking that just because you can ride a horse, you can ride an alligator. Please do your own homework and accept full responsibility for any investment decisions you make. No content on this site can be used for commercial purposes without the prior written permission of the author. Copyright © 2007-2023 Bill Luby. All rights reserved.
 
Web Analytics