Showing posts with label XRT. Show all posts

Sunday, November 28, 2010

Chart of the Week: The Resurgent Consumer and Holiday Shopping

During the first half of 2010, a recovery in manufacturing helped to lift stocks. When manufacturing plateaued, stocks gave up their gains. Now it looks like manufacturing may be picking up again, but it has been consumer spending that has been responsible for much of the recent rise in equities.

There are two large ETFs devoted to retailers, XLY and XRT. While neither is a great proxy for the types of stores most likely to compete for our holiday shopping dollars, they will both pick up the major trends. I tend to have a slight preference for XRT over because XRT has more holding and these are more equally distributed. The top holding for XLY, for instance, is McDonalds (MCD).

In this week’s chart of the week below, I show the performance of XRT over the course of 2010. Note that earlier in the month XRT broke above its April high and has continued to maintain a bullish trajectory since then. Of particularly interest is the sector’s performance relative to the S&P 500 index (top study), which has been very strong since stocks began to rally in the beginning of September.

With the holiday shopping season off to a good start, XRT makes an intriguing momentum play and should be a barometer of the strength of U.S. consumer throughout the holiday season.

Related posts:


[source: StockCharts.com]

Disclosure(s): none

Monday, February 15, 2010

Chart of the Week: Retail Sales Recovering

With all eyes seemingly focused on Europe last week, it seems as if investors largely ignored the new economic data coming out of the United States.

I consider the most important of the new pieces of economic data to be the January retail sales report, which showed retail sales increasing 0.5% on a month-over-month basis (consensus estimate +0.3%) and 4.7% on a year-over-year basis.

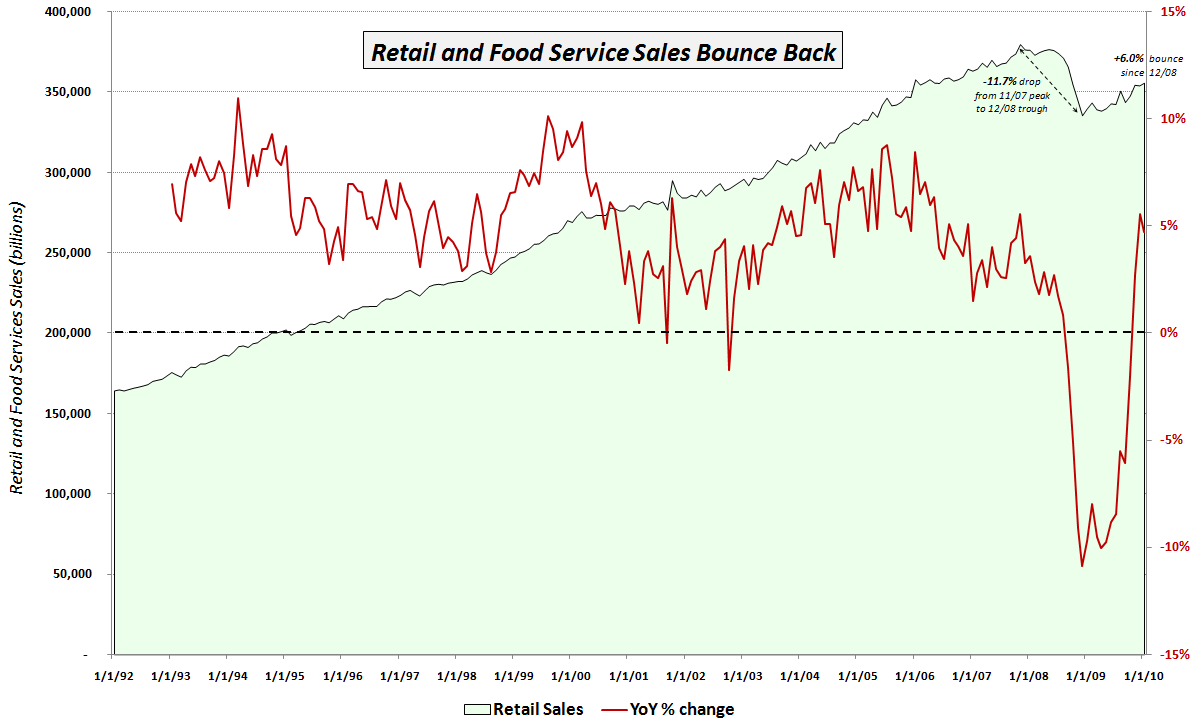
The chart of the week below attempts to put the recent retail sales numbers into a meaningful historical context. Since the media generally only reports the month-over-month change from the Census Bureau press release, I thought I would add a couple of my own twists. First, the green area data series below captures the aggregate retail and food service sales in green going back to 1992. Note that until the beginning of 2009, there was never a sustained dip in retail sales. The red line overlays the year-over-year percentage change in retail sales. Given the relatively shallow historical dips, this number was never only negative twice prior to 2008: once in 2001; and a second time in 2002.

Starting in September 2008, the year-over-year change in retail sales was negative for 14 consecutive months. That streak was finally broken in November 2009, but when retail sales slipped during December, there were rumblings about the sustainability of the bounce in retail sales. January’s positive surprise has at least temporarily shelved some of those concerns and brought new buyers into the retail sector, where the two 800 lb. gorilla ETFs (XRT and XLY) have seen renewed interest.

The chart also annotates the 11.7% drop in retail sales from the October 2007 peak to the December 2008 cycle low. Since the low, retail sales have bounced 6.0% or 2.7% in real terms. It will likely be another year or two before retail sales return to their October 2007 highs, but to this point, the consumer has been much more resilient than many pundits had expected.

For more on related subjects, readers are encouraged to check out:


[source: Federal Reserve Bank of St. Louis]

Disclosures:
none

Sunday, November 15, 2009

Chart of the Week: Four Key Sectors Struggle

While I still have at least one and a half feet placed firmly in the bull camp, I am increasingly concerned with a number of signs from some key technical indicators. Near the top of my list of concerns is market breadth, as measured by the McClellan Summation Index and other similar market breadth indicators. The bottom line is that if the indices continue to advance on the strength of a narrow base of rising stocks while the majority of issues move sideways or decline, then the rally will have trouble sustaining itself.

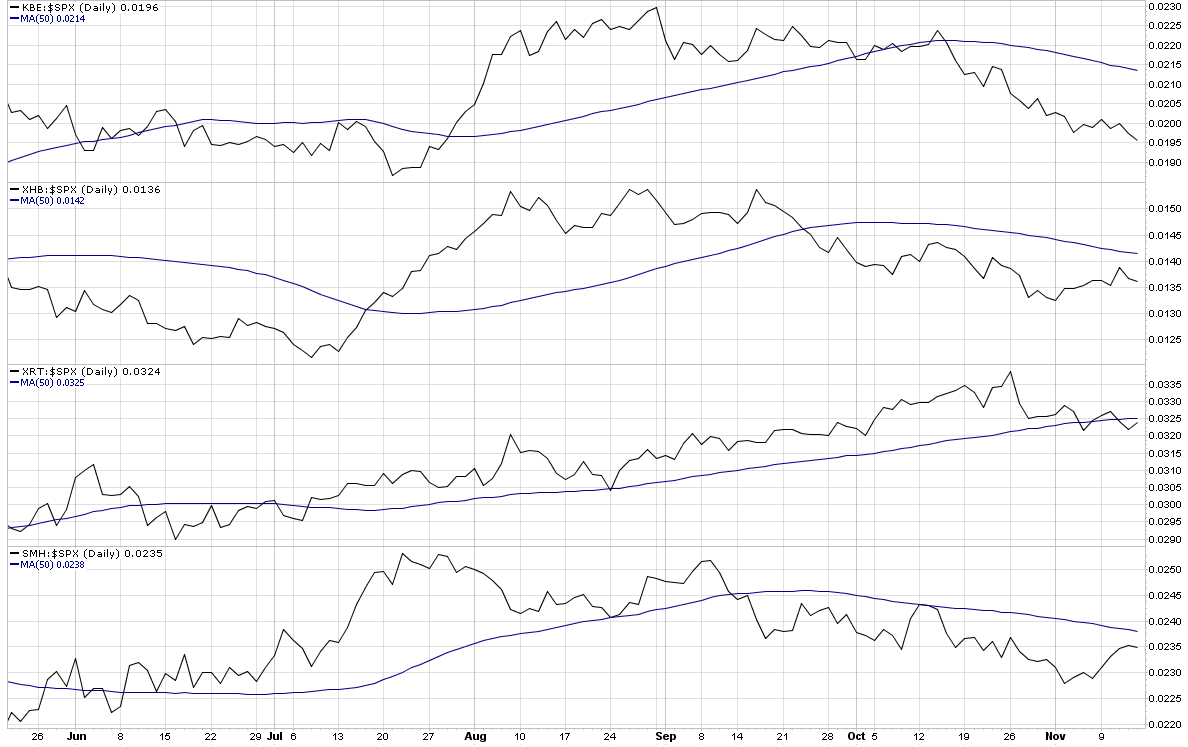
During the last few weeks, several key sectors have been underperforming the S&P 500 index, notably banks (KBE); homebuilders (XHB); retailers (XRT); and semiconductors (SMH). This week’s chart of the week shows the performance of the four sectors relative to the S&P 500 index over the course of the last six months. In all four instances, these critical sectors are below the 50 day average of their ratio to the SPX and in the case of the banks, the relative performance gap is increasing almost on a daily basis.

Going forward, I would expect that the major market indices such as the SPX will have difficulty making new highs if all four of these sectors continue to underperform on a relative basis. For this reason, I will keep an eye generally on market breadth and specifically on these four key sectors.

For additional posts on related subjects, readers are encouraged to check out:

[source: StockCharts]

DISCLAIMER: "VIX®" is a trademark of Chicago Board Options Exchange, Incorporated. Chicago Board Options Exchange, Incorporated is not affiliated with this website or this website's owner's or operators. CBOE assumes no responsibility for the accuracy or completeness or any other aspect of any content posted on this website by its operator or any third party. All content on this site is provided for informational and entertainment purposes only and is not intended as advice to buy or sell any securities. Stocks are difficult to trade; options are even harder. When it comes to VIX derivatives, don't fall into the trap of thinking that just because you can ride a horse, you can ride an alligator. Please do your own homework and accept full responsibility for any investment decisions you make. No content on this site can be used for commercial purposes without the prior written permission of the author. Copyright © 2007-2023 Bill Luby. All rights reserved.
 
Web Analytics