Showing posts with label EZA. Show all posts

Thursday, August 29, 2013

Watching Two Key Emerging Markets Currencies

With Syria and the Fed grabbing most of the headlines in the last few days, I wonder how many people have emerging markets currencies at the top of their list of concerns. I am guessing few are poring over the likes of India (EPI), Indonesia (EIDO), Brazil (EWZ), Turkey (TUR), South Africa (EZA), Thailand (THD) and the Philippines (EPHE) on a daily basis. As a matter of fact, I would bet that very few people even know that there is an ETF dedicated to the Philippines.

While keeping an eye on country-specific equities is important, it is currency movements that are at the heart of the emerging markets problem right now. Of course, the issue with currencies is really little more than a downstream effect of rising interest rates in the U.S., which is a result of changing expectations about the Fed’s quantitative easing (QE) program. Since December 2008, the Fed has used a variety of policy instruments to keep interest rates as low as possible in the U.S. and has effectively driven capital to emerging markets, where higher-yield investments looked more attractive. As QE begins to unwind, the supply of easy money in emerging markets has suddenly come to a halt and countries with large current account deficits and loans denominated in dollars (which will be repaid in a local currency that is rapidly declining in value) are particularly vulnerable.

Since many equity investors do not have access to a full menu of currency crosses, I think it is important to note that there are ETPs that track two of the most important emerging markets currencies:

  • WisdomTree Indian Rupee ETF (ICN)
  • WisdomTree Brazilian Real ETF (BZF)

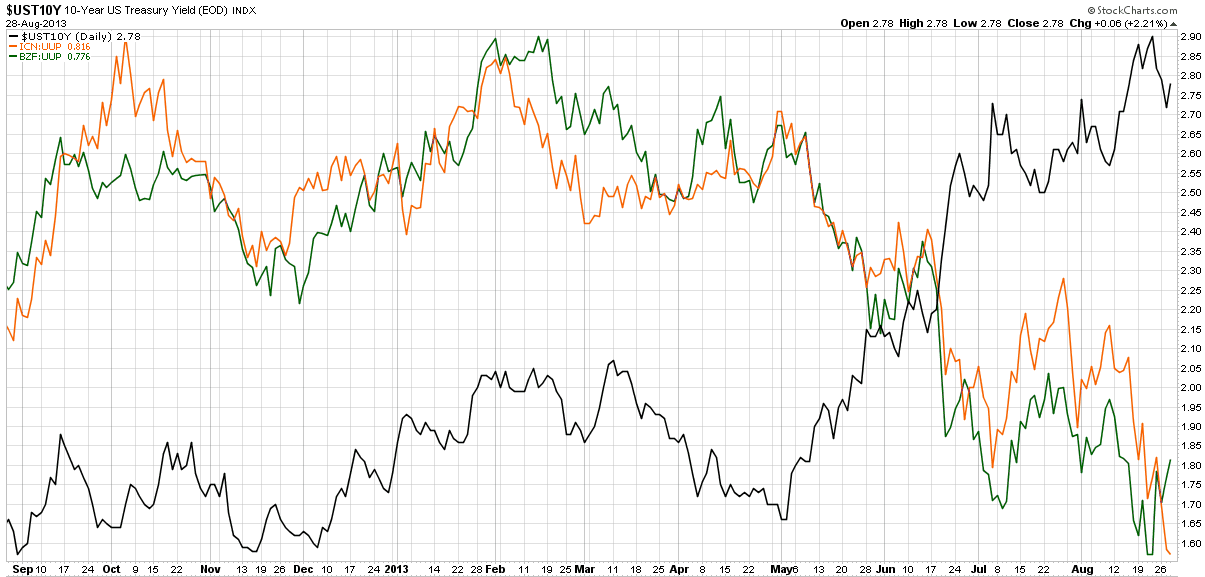
In the chart below I show the yield in the 10-Year U.S. Treasury Note (UST10Y) in the black line, along with a ratio of the Indian Rupee to the U.S. dollar (ICN:UUP) in orange, as well as a ratio of the Brazilian Real to the dollar (BZF:UUP) in green. Now these are a roll-your-own ratio of ETFs to ETFs rather than the exact currency crosses, but the charts are almost identical (and easily constructed at StockCharts.com), while the key takeaways are necessarily the same. Note that until May, ICN and BZF relative to the dollar appeared to be more positively correlated to U.S. interest rates than negatively correlated. As soon as interest rates began to rise at the beginning of May, both ICN and BZF began to rapidly lose ground against the dollar and the negative correlation with U.S. interest rates suddenly became very strong.

One last point worth noting is that the BZF:UUP ratio has seen a bounce during the course of the last week, while the ICN:UUP ratio continues to deteriorate, as there has been little to suggest that the Indian Rupee is stabilizing, even as Brazil improves somewhat.
[source(s): StockCharts.com]

For those who are interested in evaluating the risk and uncertainty in emerging markets in general, the recent VEXXM as a Measure of Emerging Markets Volatility and Risk is recommended reading for some background and information on VXEEM, the CBOE Emerging Markets ETF Volatility Index.

Related posts:

Disclosure(s): long EWZ at time of writing

Monday, February 7, 2011

Chart of the Week: EGPT and Collateral Damage

Unrest in Egypt is barely three weeks old and already the ripple effect has crossed the globe in several waves.
I find it interesting how regional and country ETFs can be of some assistance in evaluating how investors are thinking in terms of contagion risk, be it political or economic – or at the very least in terms of the breadth and depth of the economic impact of specific events.

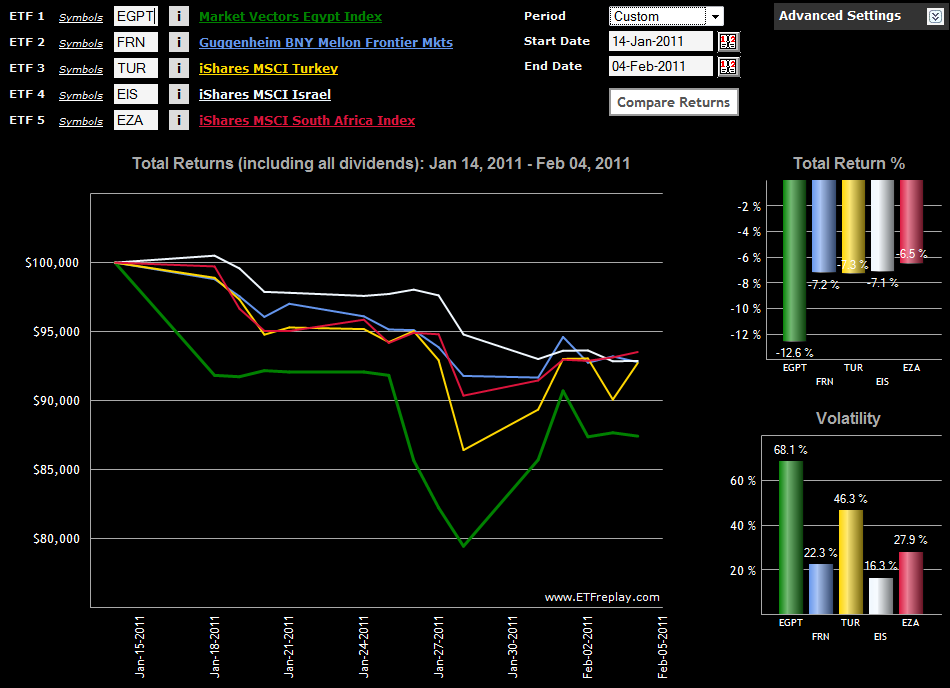
In this week’s chart of the week, I endeavor to track some elements of the relative geographical spread of concern with a handful of ETFs. The baseline ETF, EGPT, shows how the situation deteriorated over the long weekend in the U.S. from January 14th to January 18th, then began to accelerate downward during the January 26th trading session.

In terms of impact, the additional four ETFs include one broad-based frontier ETF, FRN, and three single-country ETFs: Turkey (TUR); Israel (EIS); and South Africa (EZA). Of this group, the Turkey ETF has proven to be the most volatile during the crisis and also suffered the largest drawdown. Interestingly, the Israel ETF has been the least volatile of the group, but the only one which appeared not to find a bottom on January 28th and continued to trend lower. The top performer of the group is EZA, the South African ETF. EZA has fallen slightly more than half as far as EGPT since the beginning of the crisis and has steadily gained strength during the past week. Among country ETFs, EGPT and TUR were the top two performers during the past week.

Note that there are several regional ETFs which cover northern Africa and the Middle East. I discussed these during the Dubai crisis at some length in Frontier ETFs and Chart of the Week: Market Vectors Gulf States ETF (MES).

Related posts:


[source: ETFreplay.com]

Disclosure(s): long TUR at time of writing

Sunday, August 29, 2010

Chart of the Week: Irrepressible Colombia (GXG)

While U.S. investors can be forgiven for thinking that stocks have been stuck in a fairly narrow trading range for the last 3 ½ months, those who are scanning the globe for investment ideas are likely to have seen an entirely different investment climate.

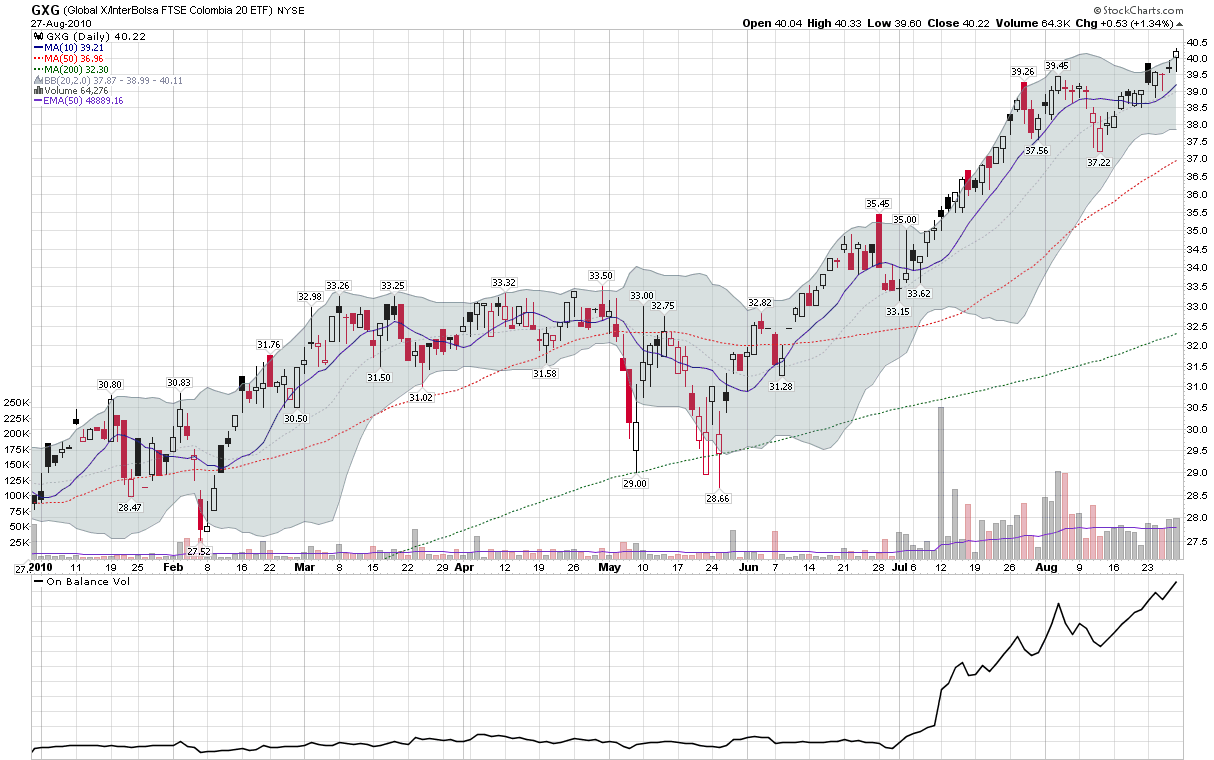
A case in point is the Global X/InterBolsa FTSE Colombia 20 ETF (GXG), which has regularly been showing up as one of the top geography-based ETFs in my weekly newsletter. GXG is up 42% in 2010, handily outdistancing the BRIC ETF, EEB, and the popular broad-based emerging markets ETF, EEM, which are down -4.8% and -1.8% year-to-date, respectively.

Whereas BRIC has been a popular emerging markets investment theme for the past few years due to the popularity of Brazil (EWZ), Russia (RSX), India (EPI) and China (FXI), some have suggested that the current decade may turn out to be the decade of so-called frontier ETFs, with countries like Colombia, Indonesia (IDX), Vietnam (VNM), Egypt (EGPT), Turkey (TUR) and South Africa (EZA) among the top performers. These frontier ETFs already have their own catchy acronym, CIVETS, in order to make them easier to recall.

In terms of economic firepower, don’t expect the CIVETS to displace the BRIC countries, but when it comes to returns, the CIVETS are already off and running. With the best performance of any country ETF so far in 2010, Colombia has been acting like the new lead dog and has earned the spotlight as this week’s chart of the week.

Related posts:


[source: StockCharts.com]

Disclosure(s): long GXG, IDX and VNM at time of writing

DISCLAIMER: "VIX®" is a trademark of Chicago Board Options Exchange, Incorporated. Chicago Board Options Exchange, Incorporated is not affiliated with this website or this website's owner's or operators. CBOE assumes no responsibility for the accuracy or completeness or any other aspect of any content posted on this website by its operator or any third party. All content on this site is provided for informational and entertainment purposes only and is not intended as advice to buy or sell any securities. Stocks are difficult to trade; options are even harder. When it comes to VIX derivatives, don't fall into the trap of thinking that just because you can ride a horse, you can ride an alligator. Please do your own homework and accept full responsibility for any investment decisions you make. No content on this site can be used for commercial purposes without the prior written permission of the author. Copyright © 2007-2023 Bill Luby. All rights reserved.
 
Web Analytics