Showing posts with label BRIC. Show all posts

Tuesday, July 2, 2013

Charting the Recent Decline of the BRIC Components

U.S. stocks are mostly green in today’s session, though there is a good deal of red in global stocks, notably in emerging markets, where the popular EEM emerging markets ETF is down close to 1% as I type this and the Brazil (EWZ) is down more than 2%.

In the chart below, I plot the recent decline of the four large BRIC emerging market country ETFs: Brazil (EWZ); Russia (RSX); India (EPI); China (FXI). While all four country ETFs have declined between 8% and 20% during the past six weeks, the various woes afflicting each country appear to be country-specific to a large extent, though obviously the issues affecting China’s manufacturing base and export market have a significant upstream impact on Brazil.

Emerging markets in general have been struggling as of late, but difficulties in Brazil, India and China have helped to fuel a global selloff.

Going forward, investors will be well-served to keep an eye on all four components of the BRIC block, as well as aggregated BRIC ETFs, such as the most popular issue in this space: the iShares MSCI BRIC Index (BKF).

For those who are interested in evaluating the risk and uncertainty in emerging markets in general, the recent VEXXM as a Measure of Emerging Markets Volatility and Risk is recommended reading for some background and information on VXEEM, the CBOE Emerging Markets ETF Volatility Index.

[source(s): StockCharts.com]

Related posts:

Disclosure(s): long EEM at time of writing

Thursday, June 20, 2013

VXEEM as a Measure of Emerging Markets Volatility and Risk

If you think U.S. stocks have been through a rough patch as of late, then you haven’t been paying attention to emerging markets stocks, where the popular EEM emerging markets ETF as fallen from a high of 42.96 on May 22nd to 37.02 earlier today – a 13.8% drop in less than one month. A large part of the problem has been the performance of the BRIC countries, where Brazil (EWZ), China (FXI) and India (EPI) are all acting as if they have been thrown overboard with anchors tied to their ankles, making Russia (RSX) look like the most stable investment of the group – which is quite a task.

Investors looking to monitor risk and uncertainty in Brazil and China are fortunate enough to have dedicated volatility indices based on the VIX methodology for EWZ and FXI. These volatility indices were created by the CBOE and use the tickers VXEWZ and VXFXI, respectively. For a more holistic view of risk and uncertainty in the emerging markets space, the best choice is probably VXEEM, the CBOE Emerging Markets ETF Volatility Index that is calculated based on options in EEM.

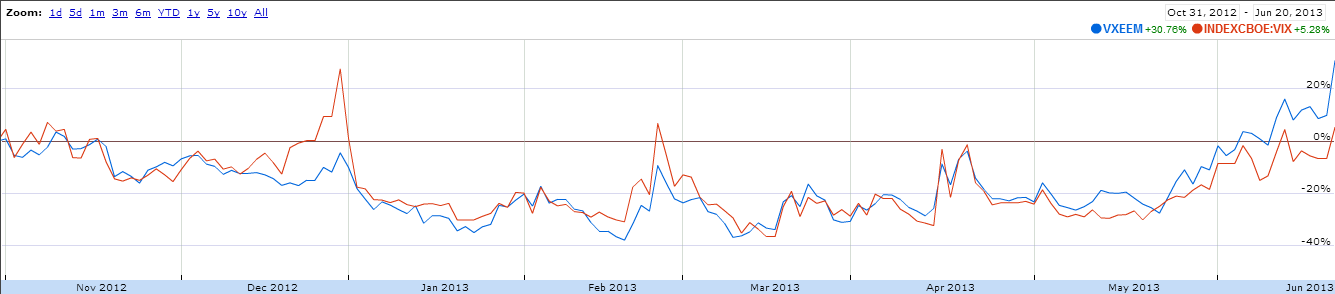
The chart below shows the relative performance of VXEEM and the VIX going back to the end of October 2012. Note that during toward the end of 2012, the debate over sequestration caused the markets to assign much more additional risk and uncertainty to U.S. stocks than to emerging markets stocks. During the course of the last month or two, this relationship has reversed and the risk and uncertainty associated with VXEEM has grown at a much faster rate than that of the VIX. On average, the absolute level of VXEEM is about 40% higher than that of the VIX. This week, however, VXEEM has been about 60% higher than the VIX.

On a related note, I find it interesting that S&P announced the launch of the S&P Emerging Markets Volatility Short-Term Futures Index just ten days ago. With that index in place, it would be relatively easy to create a futures-based emerging markets volatility ETP that would function in the same manner as VXX, but be based on VXEEM rather than the VIX. The biggest obstacle to this type of product is probably the current lack of liquidity in the VXEEM futures market.

[source(s): Google Finance]

Related posts:

Disclosure(s): short VXX at time of writing

Monday, December 14, 2009

The BRIC Bull

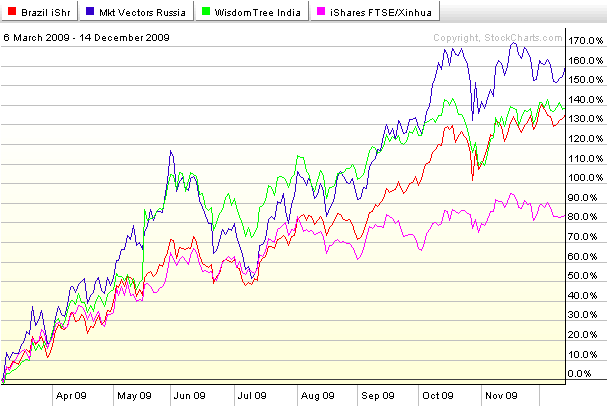
The last time I wrote about the relative performance of the BRIC countries was a little over eight months ago, in Russia Leading the BRIC Rally. At that time, the bounce off of the March lows was barely a month old and Russia (RSX) was leading the way, followed closely by India (EPI), with Brazil (EWZ) and China (FXI) not rallying quite as sharply.

Fast forward eight months and Russia is still out in front, but starting to look a little tired. For all the talk of a Chinese bubble, FXI, the most popular Chinese ETF, is a distant fourth and falling farther behind the other BRIC ETFs with each passing week. Since the end of October, the top performers have been India and Brazil. In fact the top India ETF (EPI) is now 21% higher than it was the day before the Lehman Brothers bankruptcy, while the Brazil ETF is 29% higher than its was trading just before the Lehman debacle.

Looking ahead to 2010, I expect Russia will have considerable difficulty remaining the top performer. I would not be surprised to see Brazil eclipse the bunch, followed by India and a resurgent China. One thing is certain: if investors can predict the plight of the BRIC ETFs in 2010, quite a few of the other pieces of the investment puzzle will magically begin fall into place.

For more on related subjects, readers are encouraged to check out:

[source: StockCharts]

Disclosure: none

Saturday, April 11, 2009

Russia Leading the BRIC Rally

The last time I checked in with the BRIC countries, four months ago, the issue de jour was BRIC Update: China a Leader or an Outlier? At that time, China was starting to move impressively off of an October bottom and Russia was a notable laggard.

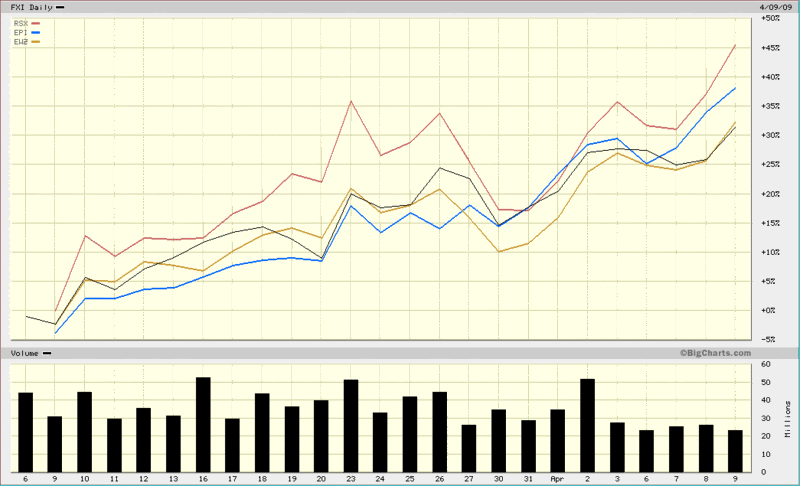
As the chart below shows, in the five weeks since the U.S. stock indices have bottomed, it is Russia (RSX, red line) that has been the strongest performer, followed by India (EPI, blue line), with Brazil (EWZ, gold line) and China (FXI, black line) bringing up the rear.

I watch these relationships closely for a number of reasons, not the least of which is to determine how well the group as a whole is performing, if any particular country is separating itself from the pack, whether commodity producers or consumers are in favor, etc.

Part of the reason Russia has bounced more than its BRIC counterparts is that Russia suffered disproportionately in the recent bear market. In the nine months from June 2008 to February 2009, the RSX Russian ETF lost more than 82% of its value. The last month, however, has seen some notable improvements. Russia’s credit default swaps, for instance, which reflect to the cost to insure the country’s debt, have improved from 694 to 412 in the last four weeks as the outlook for that country’s sovereign debt has improved dramatically.

Going forward, country-specific trends may continue to dominate, but I suspect the relative performance of Russia and Brazil will say more about improvements in the commodities market as a whole than about the plight of a particular national economy.

[source: BigCharts]

Tuesday, December 9, 2008

BRIC Update: China a Leader or Outlier?

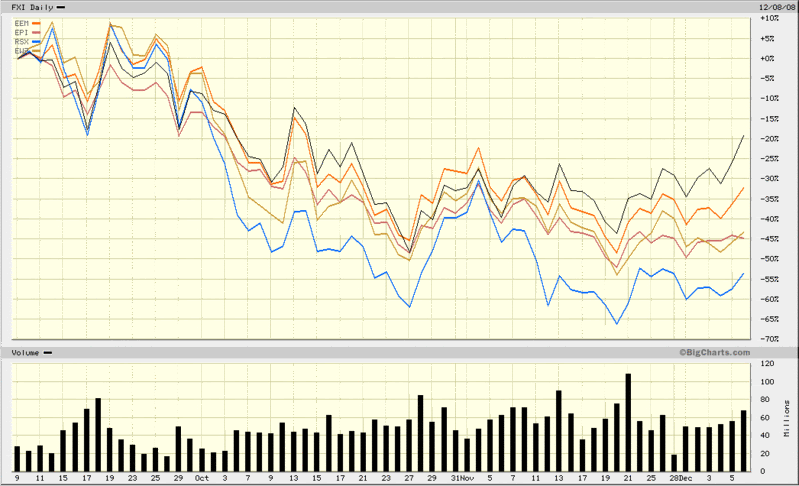
I have commented on resurgent Chinese stocks several times in the past few weeks, most recently in China About to Break Out? Now that Chinese stocks (FXI, black line) appear to be on the rebound, an important question is whether this is an isolated phenomenon or one that will also affect other emerging markets economies.

As the chart below shows, the rally in Chinese stocks has significantly outdistanced the recent bounce in emerging market stocks (EEM, orange line). It is the other three members of the BRIC group, however, that are lagging China and the broad emerging markets group the most. Not surprisingly, commodity-rich Russia (RSX, blue line) is the biggest laggard among the BRIC countries, while India (EPI) and Brazil (EWZ) are trailing the broader emerging markets index, but performing better than Russia.

The question of whether growing domestic demand and a massive government stimulus package will result in a China-specific rebound or help pull other global economies along for the ride is not likely to be answered soon. In the meantime, China looks strong on a relative basis and other emerging economies should be watched closely for clues about the geographical breadth of the rally.

[source: BigCharts]

Thursday, September 11, 2008

The U.S. VIX vs. a BRIC VIX

India has an India VIX, Germany has the VDAX, and some other countries (largely in Europe) have their own country volatility indices. Outside of North America and Europe, the volatility index pickings are slim, however, so when you want to get a sense of international volatility on a broader scale, you have to roll your own.

Which is exactly what I have done today.

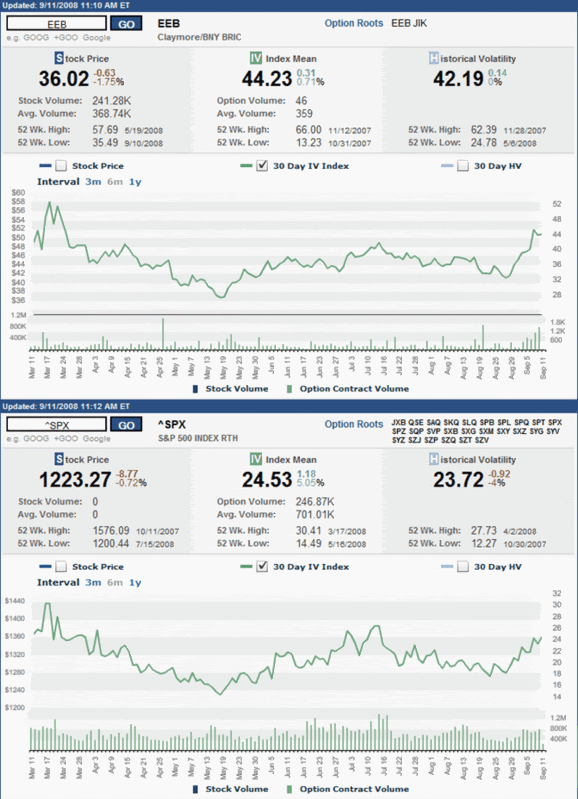
In the chart below, the bottom half is a six month chart of implied volatility in the S&P 500 index. It is similar, but not identical to the VIX. Note the March high, a second peak in mid-July, and the recent uptrend in volatility.

On the top half of the chart is the implied volatility in the Claymore BHY BRIC (Brazil, Russia, India, and China) ETF (EEB), which attempts to replicate the performance of the Bank of New York BRIC Select ADR index. In contrast to the SPX, implied volatility in the BRIC ETF was relatively moderate in July, but has spiked dramatically over the course of the past two weeks. In short, fear and anxiety may be rising slowly in U.S. markets, but in the critical economies of Brazil, Russia, India, and China, signs of panic are much more widespread.

If emerging markets are the buffer whose continued growth is supposed to buttress developed markets in this economic slowdown, then emerging markets need to find their own firm ground and soothe anxious investors before they can be expected to lubricate the wheels of the global economy.

[source: International Securites Exchange]

Monday, August 27, 2007

Portfolio A1 Appears to Find a Bottom

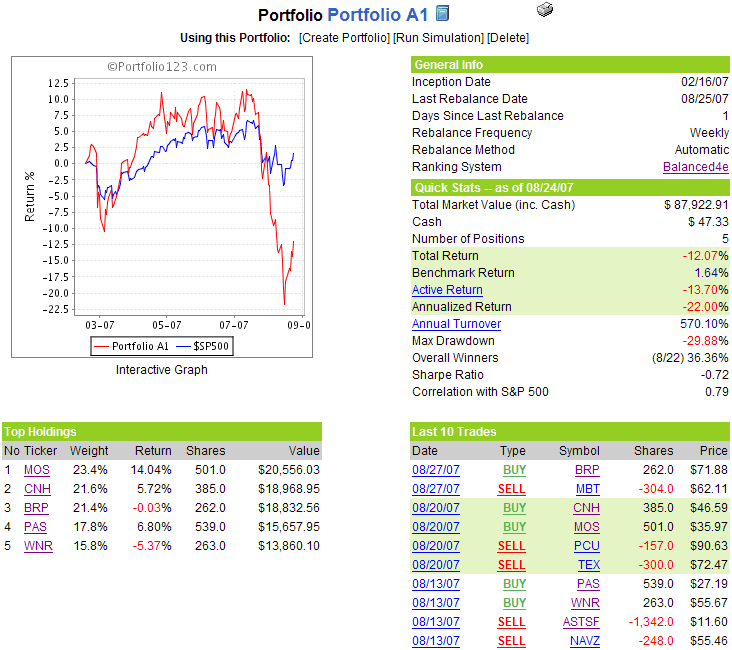
After four weeks of performance that you wouldn’t want to be downwind of, it seems appropriate that it took a new addition to the portfolio – and a fertilizer company at that – to turn around Portfolio A1. The fertilizer company, Mosaic (MOS), surged 14% last week, while the other portfolio newcomer, agricultural equipment maker CNH Global (CNH) posted a weekly return of 5.7%. For now at least, the agricultural theme is working.

The aggregate portfolio statistics are still on the ugly side, with the portfolio down 12% since the February 16th inception, well behind the benchmark S&P 500’s 1.6% gain during the same period. With a Sharpe ratio of -0.72, a winning percentage of 36%, and a maximum drawdown of 29.9%, one has to look long and hard to find a silver lining in the portfolio’s performance. Still, I will ride this portfolio out through the end of the year, at which time I will introduce a new portfolio with a strong discretionary component, as I outlined last week.

This week Portfolio A1 swaps BRIC telecoms by saying goodbye to Moscow-based Mobile TeleSystems OJSC (MBT) and replacing it with Brasil Telecom Participacoes (BRP), an ADR that the discretionary trader in me likes a great deal. There are no other changes to the portfolio this week.

A snapshot of the portfolio is as follows:

Sunday, July 8, 2007

Portfolio A1 Swaps Oils: PBR for TSO

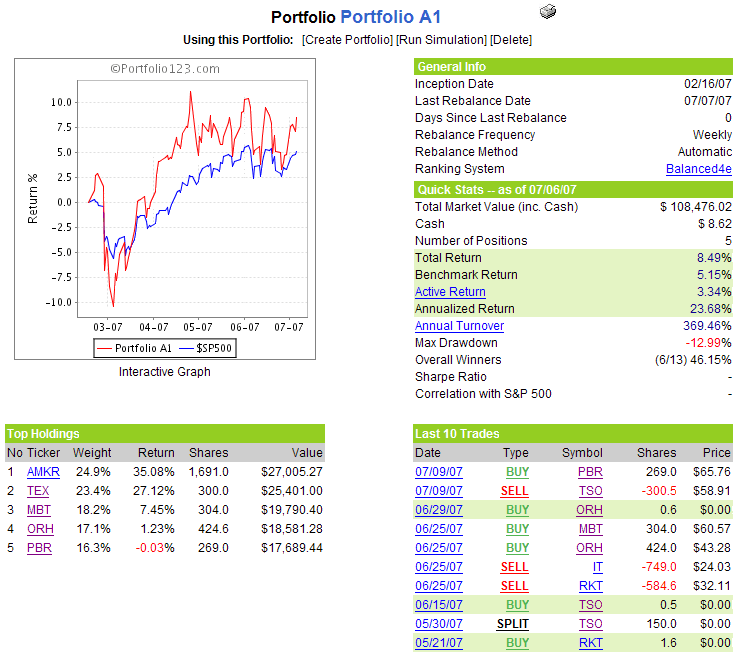
For someone who is largely a discretionary trader, one of the more difficult aspects of a fully mechanical trading system is sitting on the sidelines trying to get up the enthusiasm to root for stock that you wouldn’t otherwise follow. Rarely do I watch Portfolio A1 dump one stock in favor of another, pump my fist in the air and yell at my monitor, “It’s about time, dammit!” Today is one of those days, however, as I can let my lukewarm feelings about the refiner Tesoro (TSO) depart along with the stock, while at the same time welcome into the Portfolio A1 fold Petroleo Brasileiro (PBR), the state-owned Brazilian whose stock has traced almost a straight line over the past five years in rising from 5 to 65, all while generally paying a 2% dividend in the process. PBR has been a favorite of my discretionary portfolios for several years and I can only hope that it hasn’t gotten ahead of itself at this stage.

Speaking of newcomers, last week’s strong portfolio performance was led by newcomer Mobile TeleSystems OJSC (MBT), whose 7.5% weekly gain helped to more than double the portfolio’s advantage over the benchmark S&P 500 from 1.5% to 3.3%. With Russia and now Brazil, 2/5 of the portfolio is invested in ADRs; and when you consider that portfolio stalwart Terex (TEX) has a strong China component, it is worth noting that Portfolio A1's stock ranking system is unwittingly endorsing the BRIC growth thesis, albeit with limited exposure to India.

Now that my discretionary portfolio overlaps this mechanical portfolio as far as PBR, TEX and AMKR are concerned, it will be interesting to see if Portfolio A1’s performance changes dramatically, for better or for worse.

There are no other changes to the portfolio for the coming week.

A snapshot of the portfolio is as follows:

DISCLAIMER: "VIX®" is a trademark of Chicago Board Options Exchange, Incorporated. Chicago Board Options Exchange, Incorporated is not affiliated with this website or this website's owner's or operators. CBOE assumes no responsibility for the accuracy or completeness or any other aspect of any content posted on this website by its operator or any third party. All content on this site is provided for informational and entertainment purposes only and is not intended as advice to buy or sell any securities. Stocks are difficult to trade; options are even harder. When it comes to VIX derivatives, don't fall into the trap of thinking that just because you can ride a horse, you can ride an alligator. Please do your own homework and accept full responsibility for any investment decisions you make. No content on this site can be used for commercial purposes without the prior written permission of the author. Copyright © 2007-2023 Bill Luby. All rights reserved.
 
Web Analytics