Volatility Storm at Two Years and Counting…
It was exactly two years ago today that the first winds of the volatility storm blew in from China. Back on February 27, 2007, concerns about the Chinese government raising interest rates to discourage speculation helped to trigger an 8.8% loss in the Shanghai Composite Index and a 9.9% loss in the FTSE/Xinhua China 25 index that is the basis for the popular Chinese ETF, FXI.
In one of the earlier challenges to the decoupling theory, stocks around the world fell in sympathy, with the Dow Jones Industrial Average losing 416 points later that day to close at 12,216. The simultaneous 64% spike in the VIX still stands as a one day record, though two years later it seems a little quaint to talk about a massive VIX spike when the VIX failed to get out of the teens.
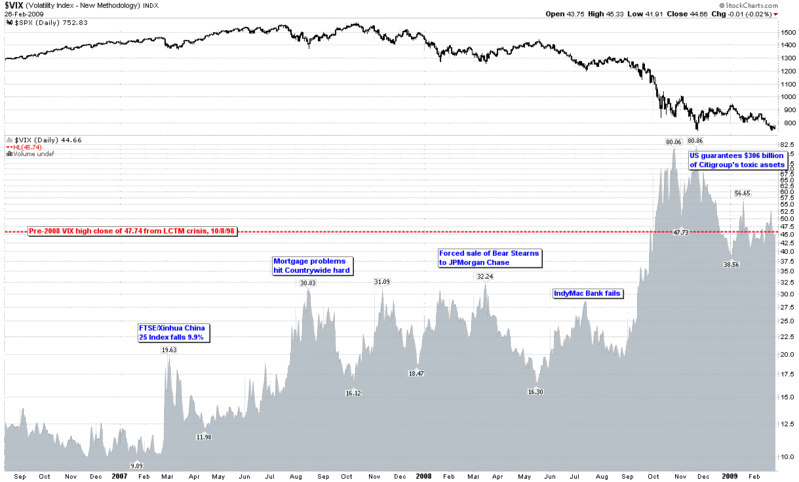
As the chart below shows, following the February VIX spike, the floor in the VIX jumped from 10.00 to 12.00 and that floor kept rising, first to 15, then 16, 18 and 22. In fact, the pattern of higher lows continued for over a year.
In the StockCharts chart, I have elected to show volatility as an area chart to emphasize the rising tide aspect of volatility. Even though the May 2008 bottom prints as a lower low and the IndyMac Bank failure in July shows up as a lower high, this turned out to be the last glimpse of somewhat normal volatility before September 2008 unleashed the full force of the volatility storm. For easy reference and archival purposes, I have highlighted a handful of fundamental events that coincided with some of the important tops in the VIX in the past two years.
It has now been two full years and counting since the big drop in China and the first global volatility ripples, yet only a few hearty souls are willing to go out on a limb and predict that the worst is behind us.
Frankly, it think it is unlikely – though certainly not out of the realm of possibility – that we will see the VIX close over 80 again during the next decade, but then again two years ago no one was predicting that it would be so easy to keep the VIX above the 40 level for five full months.
This storm will eventually blow itself out, but the coastline will never look the same again.

[source: StockCharts]


5 comments:
In theory what should the VIX do in an L-shaped recovery? Could we see the VIX go back to 10 or 20 without any real gain in the S&P from here? For example, if Beta starts dropping during a prolonged consolidation period.
One more thing, what are your thoughts on Gold Volatility? I personally do not subscribe to any near-term inflation scenario, esp since the Money Supply hasn't effectively grown even with all the the Fed and Treasury have done. I believe what is happening to Gold is the same thing that happened to Oil (all money flow without anywhere better to go).
Two tough questions, Eric.
In theory, the VIX should decline slowly if the SPX continues to go sideways. It will eventually run up against a bottom that will be influenced by the extent of concerns about financial institutions, national debt, the housing market, consumer spending power, etc. My guess is that floor is in the 22-25 range if we get 4-6 months of sideways action.
Gold volatility is at least as complicated of a subject as is the VIX. It is strange in that there are extended periods when gold and gold volatility are positively correlated and other periods when gold and gold volatility are negatively correlated. I am still trying to nail down some rules for trading gold based on gold volatility signals.
As you point out, fundamental factors may trump TA here. In the end, thinking of gold as a "monetary policy fear indicator" might not be such a bad idea.
Cheers,
-Bill
I don't think VIX will ever return to the pre-Oct. 17th levels. On Oct. 17, 2008, the options market makers lost their ability for naked shorting to hedge option positions they were holding. Since they now have to pay to borrow stocks for hedging by shorting the underlying stock, that cost is now going to be reflected in the premium pricing structure.
Awesome chart and comment about the tide changing the coastline. Well said.
I wonder if the Obama election and rally at the end of the year was the eye of the hurricane passing over us, and now we will see the backside of the storm rage on for another while...
"Sell call, buy put"
Post a Comment