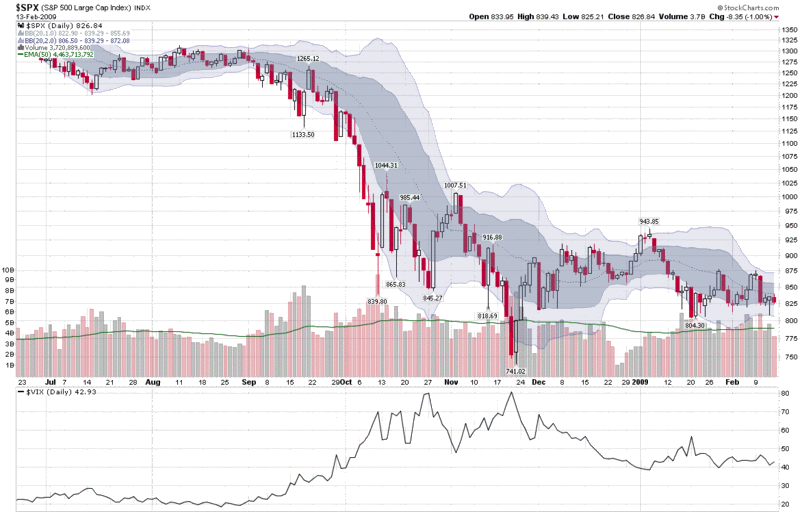
Chart of the Week: SPX Volatility on the Wane
In my chart of the week posts I have been striving for more of a generalist theme, with only occasional excursions into the land of volatility. I am making an exception this week, because for the first time in five months the historical volatility of the S&P 500 index (SPX) as measured by 10 day, 20 day, 30 day and 50 day look back periods is less than 40 in all four instances.
In the chart below, I have elected to show the fluctuations in the volatility of the SPX over the course of the past eight months as reflected in two Bollinger bands ranges. The outer range (gray) is the standard 20 day, 2 standard deviations measure. The inner range (blue) covers 20 days but only one standard deviation. The contraction of the Bollinger bands since the beginning of December and particularly in the first two weeks of February shows how volatility has been declining dramatically, notwithstanding the mid-January spike in the VIX. In fact, at current levels, the Bollinger bands are now as narrow as they have been since the week of the Lehman Brothers bankruptcy.
Given current trends, I would expect to see the VIX to be back in the 30s before the end of the month, with a VIX below 35 more likely than a VIX above 50.
Note: Those with an interest in learning more about Bollinger bands and/or customizing the settings on these indicators may wish to check out a series of posts from last June:
- Bollinger Bands: Why 20 Days?
- Bollinger Bands and the Standard Deviation Setting
- Bollinger Bands and the Percent B Setting
[source: StockCharts]


10 comments:
Question from a newbie... lower VIX, heading into the 30's, and therefore probably leading to higher $SPX?
quick question, are you using the spot VIX values or front-month VIX futures (i.e. FEB) for your comparison to Historical SPX vol numbers and where are you getting your SPX vol levels? Your insights into the VIX fut and options are very helpful. I was looking to construct my own chart of the Vix vs. SPX HV using 10 day, 20 day, etc.
With all due respect to your work I must say this:....that is exactly what they want you too believe....the reality is the vix is about to sky rocket and soon
think of everything being like upsidedown...up means down... down means up..... welcome to the market matrix.....you can hear more at Truth Be Toldish
Bill, am a noob but do appreciate your interesting articles.
You recently wrote of the symmetrical triangle in the SPX. As you know, the SP futures are right now on the bottom trend-line of that triangle. We are on the very edge of the abyss. Friday's last 5 min. sell-off with volume was creepy.
Question: how do you reconcile the truth of that article with this article and a lowering VIX? My take is that if your VIX prediction is true, we are due for a monstorous bounce rather than a descent into the abyss. Your thoughts?
Good studies on VIX. I did extensive VIX analysis during 2005 and 2006 as I found the analysis is helpful. Alerted the VIX breakout in 2006.
Have you looked at the SPX Variance Swap forward market? Seems to be indicating > 40 one year out. Also the IUG traded up Friday again. I'm also reminded that volatility can cut both ways... so perhaps a spike in vol could be tied to a spike up in the SPX.
Thanks for the comments. I am just getting caught up...
WilliamT,
With a declining VIX a higher SPX is most likely, but a sideways trend is also very likely.
Anon,
I almost always use the spot/cash VIX when I refer to the VIX. If I use VIX futures I (try to) always mention that fact. I may also start using VXX for some comparisons too.
Sethdominus,
Good luck with your VIX calls :)
Dave in Seattle,
I agree that we are not that far from an abyss, but I also think that we are very close to seeing a lot of the cash on the sidelines coming in to pick up some value plays. While the futures are down significantly right now, I still think a trading range 800-900ish is the most likely scenario for the next few weeks.
SoundView,
I must confess that I only occasionally check in on IUG and RUG, largely because I don't have good data access for those two.
Given the current level of the VIX, I expect that a sharp upward move would push the VIX down further, even if statistical measures of volatility were to increase.
For the sake of the global economies, it would be nice to find out...
Cheers,
-Bill
Bill, you sure? Look like VIX about to break to the upside and the downtrend line on the daily chart is about to get busted. Look at the SPX future now, at low 800s, and probably get busted hard to the downside tomorrow.
With all due respect to your work I must say this:....that is exactly what they want you too believe....the reality is the vix is about to sky rocket and soon think of everything being like upsidedown...up means down... down means up..... welcome to the market matrix.....you can hear more at Truth Be Toldish
With all due respect to your work I must say this:....that is exactly what they want you too believe....the reality is the vix is about to sky rocket and soon think of everything being like upsidedown...up means down... down means up..... welcome to the market matrix.....you can hear more at Truth Be Toldish
Post a Comment