Historical Volatility Dropping Below VIX Again
One of the better tools for determining whether the VIX may be too high or too low is to compare the VIX to recent historical volatility levels in the S&P 500 index. Unlike the VIX, which is measured in calendar days, historical volatility is measured in trading days, so 21 days of historical volatility has about the same time horizon as the 30 days used in VIX calculations.
Instead of 21 day historical volatility, most practitioners seem to have standardized on 20 day historical volatility as the appropriate recent look back period. In order to get a preview of how the 20 day HV is developing, I spend a fair amount of time looking at 10 day historical volatility.
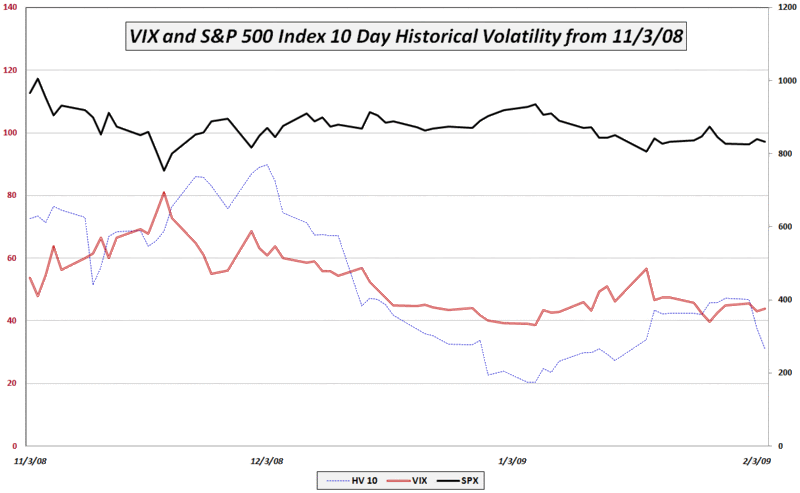
The chart below shows the SPX, the VIX, and 10 day historical volatility in the SPX going back to the beginning of November, just prior to the SPX bottom and the last big VIX spike. Note that since mid-December the VIX has been above the 10 day HV for all but five days, the period stretching from January 28th to February 2nd. With the relatively gentle movement in the SPX over the course of the past few days, the SPX 10 day HV has once again moved dramatically below the VIX, closing at 31.13 yesterday.
Unless volatility picks up dramatically, I would expect to see the VIX start moving in the direction of the SPX 10 day HV, quite possibly returning to the 30s for an extended stay, starting as early as next week.

[source: VIX and More]


5 comments:
we have seen an up leg in Sp500 this last week, while Vix traded sideways.
Could we interpret this move like a divergence in direction, a non-confirmation ?
To me, we are set for another down leg, as the vix refused to drop this week.
Bob
It looks to me like the historical vix trades around the VIX. In other words the VIX leads the historical vix. Your analysis suggests it's the other way round, and the historical vix leads the VIX.
Hi Anon,
The terminology can get confusing here, so I just want to clarify that I am not comparing the VIX with the VIX from 10 days ago, but the VIX with the historical volatility of the SPX, which is different.
That being said, I understand your point. My point was that I expected the VIX and the SPX HV10d to once again converge. That can happen in one of a few ways:
1) the VIX drops to meet the SPX HV;
2) the SPX rises to meet the VIX;
3) the two move together simultaneously;
4) or both move in the same direct, but the VIX moves down faster of the SPX HV moves up faster
I do not believe that as a rule the convergence has to favor one of the above patterns over the other three. I was merely expressing an opinion that this time around I thought a drop in the VIX would explain most of the convergence.
For the record, yesterday the VIX dropped 0.36 and the SPX HV10 rose 2.33, so the convergence has already begun, with the SPX HV doing the brunt of the work.
Cheers,
-Bill
Bill,
Maybe I being too lazy to think but why is this any different from say a 10 day simple moving average for VIX.
S&P 500 VIX has fallen below 10, 50 and hovering just above 150 SMA.
The market seem to healing after the tremendous volatility from 4Q.
Sorry for the belated response, Senta. I will cover this issue in future posts, but the VIX covers future expectations of volatility and historical volatility measures volatility via actual price moves.
When what happens is different than what was expected, these can give two very different numbers.
Cheers,
-Bill
Post a Comment