Showing posts with label IEF. Show all posts

Monday, July 5, 2010

Chart of the Week: Record Low Yields for the 2-Year U.S. Treasury Note

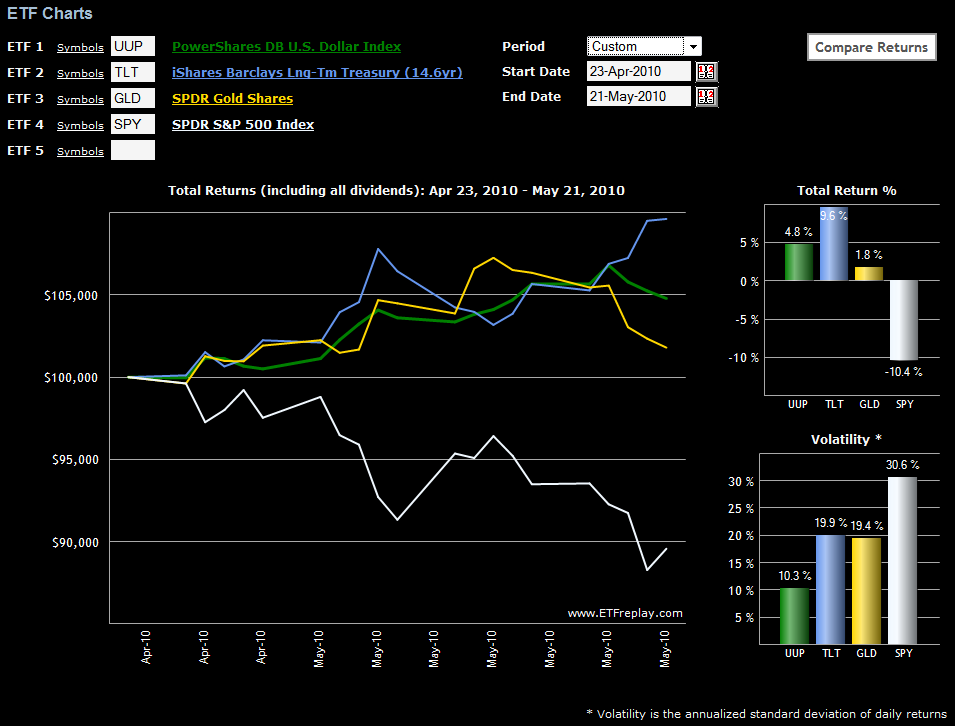
As noted a week ago in Revisiting the Flight-to-Safety Trade, there are a handful of ways in which to keep an eye on the pulse of investor anxiety. These include U.S. Treasuries (including the various ETFs, such as TLT, IEF and SHV), the dollar (UUP), and gold (GLD). In terms of volatility, the preferred vehicles are the VIX, VIX futures and VXX.

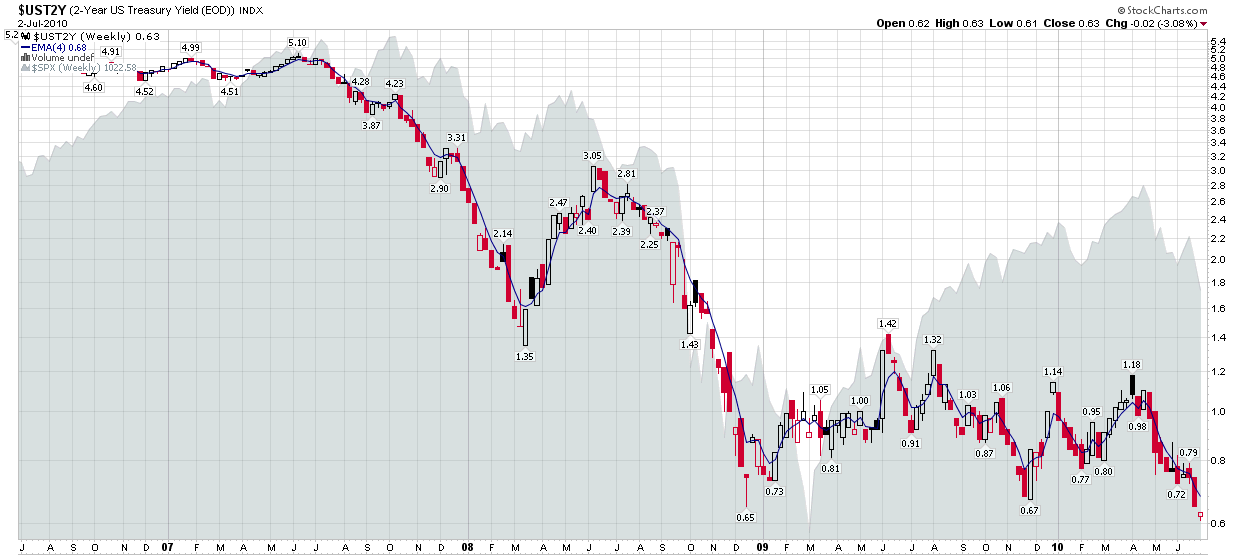
For the last two weeks or so, stocks have been under considerable pressure, yet the action in the dollar, gold and volatility have been relatively mild and far short of panic. One has to look at U.S. Treasuries to see signs of extreme anxiety in the charts. This week’s chart of the week below shows weekly bars of the yield on the 2-Year U.S. Treasury Note going back four years. The yield on the 2-Year Note reflects an amalgamation of several factors, including the Fed’s easy money policy, potential deflationary speculative plays and demand which results from the flight-to-safety trade when investors are fearful of owning stocks, commodities and other investment vehicles. While it is difficult to disaggregate the component influences on the yield, it is safe to say that the record low yields seen last week include an important flight-to-safety component and are an excellent proxy for investor fear and anxiety.

For some of my thinking on why the VIX was unusually sluggish last week, see Impromptu VIX Talk, where Adam Warner (Daily Options Report) and I confirm that once again we have independently arrived at the same conclusions regarding volatility. [For those conspiracy theorists who wonder why we have never been seen in the same room, perhaps Adam's capture of our IM banter will quell thoughts of the ghost blogger typing away on the grassy knoll.]

For more on related subjects, readers are encouraged to check out:


[source: StockCharts.com]

Disclosure(s): short VIX and VXX at time of writing

Sunday, May 23, 2010

Chart of the Week: The Flight-to-Safety Trade

This week’s chart of the week looks at some of the various flight-to-safety trades that investors have been taking advantage of since the recent closing high of 1217 in the S&P 500 index from April 23rd.

In the chart below, note that first gold (GLD) and then the dollar (UUP) peaked as hedges against stock declines. More recently, U.S. Treasuries have been the favored flight-to-safety vehicle, with the long bond ETF (TLT) outperforming the other two alternatives and shorter-term Treasury ETFs such as IEF, not shown, attracting quite a few buyers.

Also not shown in the chart below is VXX (iPath S&P 500 VIX Short-Term Futures ETN), which is more of a hedge than a flight-to-safety alternative. During the last month VXX is up 81.3%, with a volatility level of 113.6.


[source: ETFreplay.com]

Disclosure(s): short VXX at time of writing

Sunday, April 11, 2010

Chart of the Week: 10-Year Treasury Note Yield

I’ll be the first to admit that I have never considered myself a ‘bond guy’ and I spend much less time than I probably should studying the bond market. That being said, I know I have quite a few equity-centric readers who think the bond market moves too slowly to warrant their attention. The attitude is frequently, “I’ll never be a bond trader, so why should I spend my time watching bonds?”

My quick answer to bond skeptics is that bonds can help to divine the direction of interest rates and bonds frequently make major market turns before stocks do. Additionally, with the advent of bond ETFs such as the highly liquid TLT (and its +3x and -3x counterparts, TMF and TMV), it is now much easier for the retail investor to trade the U.S. Treasury long bond and their volatile triple ETF counterparts, as well as some of the shorter-dated Treasury ETFs, such as IEF, which is comprised of U.S. Treasury Notes with a target maturity of 7-10 years.

The bond world is so large that I have singled out one particular bond in this week’s chart of the week as the bond number for non-bond people to follow. The chart is the yield on the 10-Year U.S. Treasury Note, which is the de facto benchmark for government and sometimes even for corporate bonds as well.

Note that the yield on the 10-Year Treasury Note just hit 4.00 last week, attracting buyers such as BlackRock (BLK), which found the steep yield curve a good reason to buy some of the 10-Year Treasury Notes.

For those who wish to dive further into the subject of intermarket relationships such as the link between bonds and stocks, an excellent place to start is with John Murphy’s Intermarket Analysis.

For more on related subjects, readers are encouraged to check out:


[source: StockCharts.com]

Disclosure(s): short TLT at time of writing

DISCLAIMER: "VIX®" is a trademark of Chicago Board Options Exchange, Incorporated. Chicago Board Options Exchange, Incorporated is not affiliated with this website or this website's owner's or operators. CBOE assumes no responsibility for the accuracy or completeness or any other aspect of any content posted on this website by its operator or any third party. All content on this site is provided for informational and entertainment purposes only and is not intended as advice to buy or sell any securities. Stocks are difficult to trade; options are even harder. When it comes to VIX derivatives, don't fall into the trap of thinking that just because you can ride a horse, you can ride an alligator. Please do your own homework and accept full responsibility for any investment decisions you make. No content on this site can be used for commercial purposes without the prior written permission of the author. Copyright © 2007-2023 Bill Luby. All rights reserved.
 
Web Analytics