Showing posts with label Strategy-in-a-Box ETFs. Show all posts

Tuesday, December 14, 2010

Treasury Yield Curve ETNs and Volatility

The subject of the VIX and Treasury yields is one I have probably not explored in sufficient detail in this space, so with some recent developments, this seems like a good time to dive into that subject.

One big reason for my interest is the recent rapid steepening of the Treasury yield curve. Another is an excellent article on two yield curve ETN plays from Timothy Strauts of Morningstar: How to Take Advantage of a Steep Yield Curve. In the article, Strauts discusses two ETNs from iPath that are designed to take advantage of a yield curve that becomes steeper or flatter. The ETNs are known formally as the iPath US Treasury Steepener ETN (STPP) and the iPath US Treasury Flattener ETN (FLAT). These innovative and exciting ETNs hold 2-year and 10-year Treasury futures and are rebalanced monthly. In many respects they represent the latest generation of what I refer to as strategy-in-a-box ETPs.

Launched in August, STPP and FLAT have started to attract some attention in the last few weeks, as Treasury yields have become more volatile.

There is not yet much of a track record, but I will be interested to see how the movements in STPP and FLAT interact with movements in the VIX. For an initial pass, I have chosen to look at STPP and FLAT in conjunction with SPY and VXZ. (Note that I chose VXZ here in order to sidestep the strong contango in the VIX futures term structure that exacerbated the price decline in VXX as of late.)

The chart below shows the performance of the yield curve ETNs since their August 10th launch. Note that so far – and particularly as of late – it has been FLAT which has been more positively correlated with changes in implied volatility expectations as measured by VXZ. On the flip side, STPP has demonstrated a higher positive correlation with stocks, at least as reflected in SPY.

Going forward, I will provide periodic updates on my observations between changes in the Treasury yield curve in the VIX and also take up the subject of how the Treasury yield curve might be able to predict the future of the VIX.

Related posts:


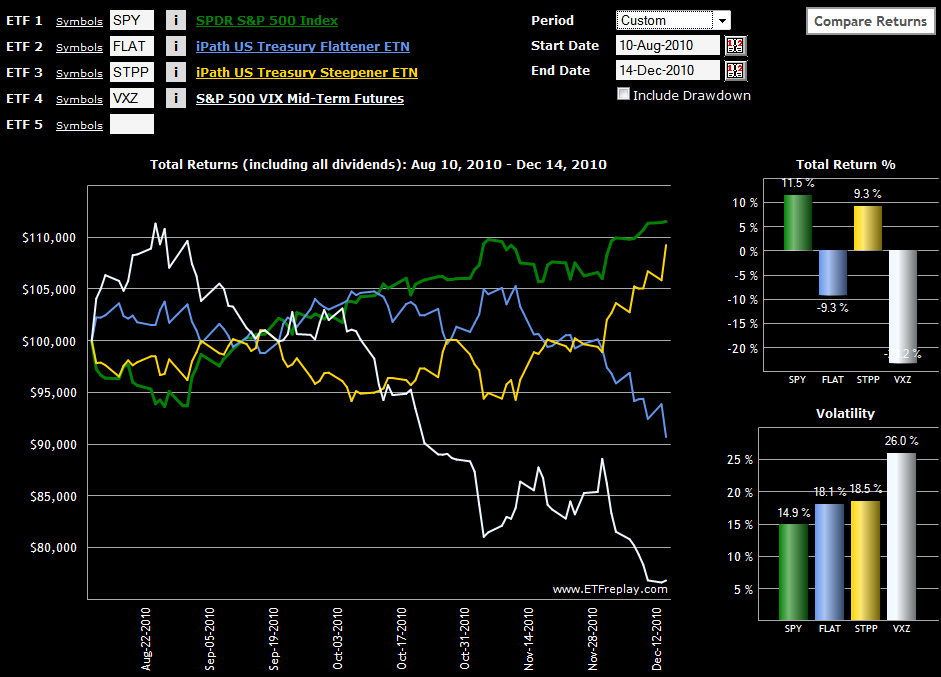
[source: ETFreplay.com]

Disclosure(s):
short VXX at time of writing

Thursday, July 29, 2010

Direxion and S&P Bring Dynamic Volatility Hedging to ETFs with VEQTOR

As the ETF space continues to evolve and push into new territory, such as strategy-in-a-box ETFs and more actively managed ETFs (e.g., QAI, ALT, PQY, PQZ, GVT, PSR, RWG), it was only a matter of time before a volatility play was added to the pool of actively managed ETFs.

Credit Direxion with being the first to venture into the realm of actively managed ETFs with a strong volatility component. In a recent SEC filing, Direxion unveiled plans to launch an intriguing new ETF under the name of S&P 500 Dynamic VEQTOR Shares. This ETF will seek to track the S&P 500 Dynamic VEQTOR Index, which was launched by S&P back on November 18, 2009.

So far, so good.

Here is where it gets interesting. The VEQTOR index (and ETF) have three components: equity (S&P 500); volatility (S&P 500 Short-Term VIX Futures Index, aka VXX) and cash. Based upon several rules and formulas, the index attempts to derive – on a daily basis – the ideal target volatility allocation. This is accomplished by evaluating realized volatility and implied volatility, determining the implied volatility trend (using 5-day and 20-day IV moving averages) and arriving at a target index volatility allocation based on realized volatility and implied volatility data. Once the target volatility allocation has been determined (the range is from 2.5% to 40.0%), the balance of the index is populated with the S&P 500.

Just to make things more interesting, the VEQTOR index also has a stop loss provision which specifies that if aggregate losses during any five day business period are 2% or higher, the index will move into a 100% cash position.

When the VEQTOR ETF is launched, I will have a lot more to say about this fascinating product. In the meantime, those interested in additional information on the VEQTOR index and ETF should try:

For more on related subjects, readers are encouraged to check out:

Disclosure(s): neutral position on VXX via options at time of writing

Tuesday, October 20, 2009

Diving a Little Deeper into the Strategy-in-a-Box ETFs

I was sufficiently pleased by the response to my strategy-in-a-box ETFs post that it seems appropriate to launch a follow-up post to address several questions raised or implied by readers. The biggest issues seemed to revolve around the history, performance and holdings of these ETFs. It is also important to understand the nature of the index and/or strategy that the ETF seeks to replicate, as well as the timing and methodology used to rebalance the ETFs. For each of the six aforementioned strategy-in-a-box ETFs, I have therefore also included links to a profile/summary page; the prospectus; a current list of holdings; the Morningstar performance data; and the StockCharts gallery chart:

As noted on Sunday, all but LSC have at least two years of a track record. Normally I would not consider this to be a long time, but given that it covers both strong bull and bear markets, I believe it is an appropriate time period from which to draw some conclusions. Perhaps more interesting is the rebalance period, where quarterly rebalancing seems to be the norm. I have spent a fair amount of time playing with various rebalancing methods and at least in my experience, I find it difficult to gain a meaningful edge with quarterly rebalancing.

Finally, it looks as if the strategy-in-a-box moniker is here to stay. I guess it is just a matter of time before I roll out screw top, synthetic cork and real cork strategies. Perhaps then we can turn our attention to the next dimension, Jeroboam, Methuselah and Nebuchadnezzar strategies…

[For all of you who think I may be spending too much time near the fermentation tanks, it was only two years ago that my weekly volatility analysis came with a wine pairing…]

Sunday, October 18, 2009

Chart of the Week: Strategy-in-a-Box ETFs

With interest growing in actively managed ETFs, there is another category of ETFs (and ETNs) out there which I believe has been unfairly overlooked by most investors. I do not have a name for these ETFs, but rather than represent asset classes, sectors, geographies, and other typical ETF constructs, they seek to replicate specific investment strategies. Until someone tags them with a better name, I am going to call them strategy-in-a-box ETFs.

Depending upon how you define the strategy-in-a-box concept, you can find various ETFs that may or may not conform to that definition, but six that clearly fit the profile, have attracted some investor interest and that I try to monitor are:

  • Elements S&P CTI ETN (LSC) – a long-short commodity technical momentum ETF
  • Claymore/Sabrient Insider ETF (NFO) – targets companies where there are favorable corporate insider buying trends and recent earnings estimate increases by Wall Street analysts
  • PowerShares DWA Technical Leaders (PDP) – focuses on companies exhibiting strong relative strength as measured by Dorsey Wright & Associates Technical Leaders Index
  • PowerShares Value Line Industry Rotation (PYH) – is based on the Value Line Industry Rotation Index, which is derived from Value Line’s measure of stock timeliness and industry timeliness
  • PowerShares Value Line Timeliness Select (PIV) – unlike the ETF above, utilizes three core Value Line ranking systems that incorporate timeliness, technical ranking and safety
  • Claymore/Zacks Country Rotation (CRO) – which attempts to track the Zacks Country Rotation Index

What can you do with this motley group of ETFs? For starters, since all have been around for at least 15 months (all but LSC for more than two years), you can see how some of these strategies have worked in real-time bull and bear market conditions. For instance, if you just happened to get bullish on March 9th, which of the above ETFs would have provided the best returns? The chart of the week below shows that the Claymore/Sabrient Insider ETF (NFO) has led the pack, more than doubling over the course of the past seven plus months. The second best performer has been CRO, the Claymore/Zachs Country Rotation ETF. The PowerShares DWA Technical Leaders (PDP) has returned about the same as the SPX during the bull market. Interestingly, the Elements S&P CTI ETN (LSC) has actually lost money during the strong bull market in stocks.

I will have more to say about these ETFs and about their actively managed ETF cousins going forward. In the meantime, feel free to suggest a better name than strategy-in-a-box…

[source: StockCharts]

DISCLAIMER: "VIX®" is a trademark of Chicago Board Options Exchange, Incorporated. Chicago Board Options Exchange, Incorporated is not affiliated with this website or this website's owner's or operators. CBOE assumes no responsibility for the accuracy or completeness or any other aspect of any content posted on this website by its operator or any third party. All content on this site is provided for informational and entertainment purposes only and is not intended as advice to buy or sell any securities. Stocks are difficult to trade; options are even harder. When it comes to VIX derivatives, don't fall into the trap of thinking that just because you can ride a horse, you can ride an alligator. Please do your own homework and accept full responsibility for any investment decisions you make. No content on this site can be used for commercial purposes without the prior written permission of the author. Copyright © 2007-2023 Bill Luby. All rights reserved.
 
Web Analytics