Showing posts with label VXZ. Show all posts

Tuesday, March 15, 2022

Barclays Suspends Creation Units for VXX

 Earlier today, Barclays announced the suspension of issuance of new creation units as well as sales from inventory for two of its ETNs: the iPath Series B S&P 500® VIX Short-Term Futures ETN (VXX); and the iPath Pure Beta Crude Oil ETN (OIL).  VXX is the premier VIX-based ETP and has been the most popular subject on this blog for the past 13 years.  It was the first VIX ETP to launch back on January 30, 2009 (along with VXZ) and remains the flagship product in the volatility space, averaging 70 million shares traded per day and regularly placing among the top five ETPs in terms of both share volume and options volume.

While the news from Barclays was a surprise, it was not unprecedented.  Credit Suisse suspended creation units in TVIX (a +2x version of VXX) twice: once in dramatic fashion in February 2012; and again in July 2020, when the product was delisted and moved to the pink sheets to trade under the TVIXF ticker.

The first time around, on February 21, 2012, there was not a VIX spike, per se, that triggered the event.  Instead, it was the general popularity of the product and the size of holdings in the TVIX note (ETNs are an unsecured debt note) that concerned the bank.  Credit Suisse acknowledged that the TVIX note violated the bank’s risk management rules related to the “internal limits on the size of the ETNs” and thus triggered the suspension of creation units.

The second time around, on July 12, 2020, the record volatility spike associated with the onset of the pandemic caused the size of the TVIX note to be roughly half of the size of the bank.  As a result, Credit Suisse concluded that the risk of continuing with this product was too high, so they decided to exit the ETN business, stop issuing new creation units and delist nine ETNs.

In both 2012 and 2020, the absence of new creation units led to a supply shortage and a large premium in the market price relative to the intraday indicative value (IV).  In 2012, new creation units were halted for a month and a day, with the price of TVIX rising to an 89% premium to TVIX.IV at one point.  When TVIX creation units were restored, TVIX fell 60% in three days and soon was trading within 1% of indicative value.  In 2020, the cessation of new creation units was final and irreversible, so TVIXF has now been trading on the pink sheets for 21 months without any new creation units.  Initially, there was almost no premium in TVIXF to TVIX.IV, but the Reddit r/wallstreetbets crowd eventually latched onto the potential for a short squeeze in TVIX in early February 2021 and spiked the price of TVIXF from parity to a 43% premium in two days.  Since the initial targeting by r/wallstreetbets, the premium in TVIXF to TVIX.IV has averaged about 72% and has been as high as 160% at one point.

An even more famous and noteworthy example of investors targeting a product with no creation unit capabilities for a short squeeze is the plight of the VelocityShares Daily 3x Inverse Natural Gas ETN (DGAZF), which spiked from 400 to 24,000 in a week in August 2020.  The VelocityShares Daily 3x Inverse Natural Gas ETN was traded under the ticker DGAZ when it delisted, with no new creation units along with TVIX on July 12, 2020.  The combination of longs targeting a short squeeze, limited liquidity in the OTC pink sheets, no new creation units and 3x leverage made for a historic spike of 12,000% in one week.  While such a scenario is unlikely to unfold in VXX, it is important to understand the history and the potential for outsized short squeezes when there are no creation units available to arbitrage away the difference between the heavily shorted underlying and its indicative value.

There are many other examples of ETPs that have had their creation units suspended, with resultant price anomalies.  Deutsche Bank did it with a variety of commodities ETNs in 2011 and 2012.  PowerShares also suspended creation units in the popular PowerShares DB Oil Fund (DBO) in 2015, with yet another large price spike.

While buyer beware is a good mantra to keep in mind when purchasing ETFs or particularly ETNs, it is even more important for short sellers to understand the risks of holding one or more of these products short when creation units are suspended and particularly when the products are delisted, with trading moving to the OTC pink sheets.

As for VXX, the reasons for the halt in creation units are not exactly clear.  Barclays says in their press release:

“This suspension is being imposed because Barclays does not currently have sufficient issuance capacity to support further sales from inventory and any further issuances of the ETNs. These actions are not the result of the crisis in Ukraine or any issue with the market dynamics in the underlying index components. Barclays expects to reopen sales and issuances of the ETNs as soon as it can accommodate additional capacity for future issuances.”

The underlying cause of the issuance capacity issue may be a number of factors, including the cost of hedging the position, exchange position limits or other factors.  Without knowing the underlying cause, it is difficult to predict when new creation units will be restored.  That said, as VXX appreciates in price, the size of the problem Barclays needs to tackle will continue to rise, which may further complicate the resolution process.

Of course, when new creation units are restored, one can expect that the price of VXX will almost immediately fall to that of VXX.IV.  Investors, therefore, need to understand the risks associated with long positions going forward and not find themselves in an air pocket like TVIX longs did back in March 2012.  For this reason, anyone who is insistent upon holding a long or short position in VXX should consider constructing a defined-risk position using options.  Alternatively, VIXY is an ETP issued by ProShares that holds a basket of VIX futures rather than an unsecured bank note with a promise to return the same performance as that basket of VIX futures.

It should go without saying that everything here I addressed relative to VXX is true for OIL as well and with all the turmoil in the oil markets related to events in Ukraine and Russia, there is already the potential for huge moves in the underlying.

I covered the TVIX creation units issue in considerable detail in 2012 and the links below probably provide the most comprehensive review of this matter anywhere on the internet.  I have also provided links to a number of tangential issues related to VIX ETPs and pricing anomalies.

In the graphic below, I show the divergence between VXX and VXX.IV during today’s regular trading hours (Pacific Time).  I find it interesting that it took more than three hours after the initial press release before VXX began to uncouple from VXX.IV and spike higher, ultimately reaching a 12% premium before the divergence began to narrow during the last half hour of trading.

Long-term, I still think VXX is likely to remain the premier VIX-based ETP, but Barclays has some work to do to get the creation units back and the product trading with a normal supply-demand balance.  Until then, keep a close eye on the varying premium of VXX and VXX.IV, while evaluating alternatives such as VIXY and UVXY.


Sunday, December 6, 2015

The Current VIX ETP Landscape

I have been writing about VIX ETPs since the launch of the initial duo of VXX and VXZ back in January 2009 and from 2010 onward I have been plotting all of them on a leverage/maturity grid like the one below. It is amazing how often various VIX ETP investors mentioned one of these charts when I talk to them. Even through the VIX ETP space has been relatively stable as of late, I have not updated this graphic since early 2014, so a refresh is long overdue.

For those who have not been following along over the years, I have plotted every VIX-based ETP using leverage on the Y-axis and maturity on the X-axis. With the advent of what I am calling VIX strategy ETPs, I have isolated in their own box in the lower right hand corner a half dozen of these products whose characteristics do not necessarily imply a fixed point on Cartesian coordinate system.

The key at the bottom highlights various salient features of each of these products. From previous incarnations, I have retained the presence of non-VIX legs (typically positions in SPX/SPY), the combination of both long and short legs, dynamic allocation of the legs and optionability. I have also shaded areas where there is high leverage/compounding risk as well as high roll yield risk. Not surprisingly, these risks converge at TVIX and UVXY, two of the more infamous VIX ETPs.  Another carryover is font color, where black indicates ETFs and blue is for ETNs.  This time around I have also added yellow stars for those ETPs with an average daily volume of 1,000,000 or higher and pink stars for ETPs with an average daily volume between 100,000 and 1,000,000. Note that while CVOL technically makes the cut, at today’s closing price of 0.40, any sort of meaningful reverse split to raise the price about 5 or 10 would highlight just how illiquid this issue is. In fact, only six VIX ETPs pass the one million share screen: TVIX, UVXY, VIXY, VXX, SVXY and XIV.

VIX ETPs 120615

[source(s): VIX and More]

There are three new additions to this graphic. The most notable of these are VXUP and VXDN, which were launched by AccuShares back in May. These products deserve a post (or series of posts) dedicated to some of the issues surrounding them, but the short version is that high complexity, frequent distributions and consistent tracking errors resulted in a product that investors decided was not worth their trouble. The other “new” products is, VQTS, the first ETP that tracks the SPX VEQTOR Switch Index, making it a relative of VQT and PHDG, but one which uses a dynamic allocation to VIX futures to achieve a 10% target realized (historical) volatility. VQTS was launched in December 2014 and like most VIX ETPs, has struggled to reach critical mass.

While the VIX ETP market is showing some signs of maturing, there are many new and exciting developments in terms of low volatility ETPs and more broadly in the ETP space in general. As I am currently at the IMN 20th Annual Global Indexing & ETF Conference – and scheduled to speak on a panel, “Trading the VIX: Riding Today's Waves of Volatility” with Larry McDonald, Mark Shore and Matt Moran tomorrow – this seems like a good time to devote more time to writing and in particular to resurrecting the “and More” portion of this blog.

Related posts (a selection from literally hundreds of posts on VIX ETPs):

Disclosure(s): net short VIX, VXX, UVXY and TVIX; net long SVXY, XIV and ZIV at time of writing

Monday, August 24, 2015

Last Two Days Are #5 and #6 One-Day VIX Spikes in History

Many readers have commented that one of their favorite of my regular graphics is the table of VIX spikes of 30% or more that I update periodically in this space, along with the subsequent performance in the S&P 500 Index following these spikes.

This time around I have elected to add an additional column that identifies the catalysts involved (necessarily a subjective process) in each instance. When thinking about these catalysts, it might be helpful to compare the nature of the threat and the size of the VIX spike to changes in volatility during various high-profile historical events, an analysis I captured in Volatility During Crises. Another useful exercise is to think about the fundamental factors influencing each VIX spike in the context of A Conceptual Framework for Volatility Events, which I find particularly useful in helping to gauge just how large of a VIX spike a certain type of event might trigger.

Of course the table below has its own set of data nuggets, both fundamental and technical. One interesting statistic I find worth highlighting is the relatively high frequency of large VIX spikes that have occurred during the past five years. VIX data goes back 26 years and yet more than half of the VIX spikes in this table data are from the past five years. I think it is no coincidence that the VIX ETPs (initially VXX and VXZ) were launched in 2009 and the inverse VIX ETPs (XIV and ZIV) and leveraged VIX ETPs (starting with TVIX) were launched in the following year, when big VIX spikes suddenly became more common – much more so than during the 2008 financial crisis, the dotcom crash, etc. For additional information on the subject of more VIX spikes in spite of a generally lower volatility environment, check out 2014 Had Third Highest Number of 20% VIX Spikes.

History of 30 pct VIX Spikes w Catalysts 082415

[source(s): CBOE, VIX and More]

As noted previously, based on the data for all VIX spikes in excess of 30%, the SPX has a tendency to outperform its long-term average over the course of the 1, 3 and 5-day periods following the VIX spike. Also worth noting that that 10 and 20 days following the VIX spike, the SPX has a tendency not only to underperform, but to decline. Further, while the huge decline following 9/29/08 VIX spike tends to dwarf the other data points, even when you remove the 9/29/08 VIX spike it turns out that the SPX still loses money in the 10 and 20-day period following a VIX spike. When the analysis is extended out 50 trading days, the SPX is back to being profitable, but performing below its long-term average. On the other hand, when the analysis includes 100 days following the VIX spike, the SPX is back to outperforming its long-term average.

In summary, this data suggests that following a 30% one-day VIX spike, there appears to generally be a tradable oversold condition in stocks that lasts approximately one week, followed by a period of another month or so in which the markets typically has difficulty coming to terms with the threat to stocks. This tendency makes today’s market action even more remarkable in that today was by far the worst performance of the SPX in a day following a 30% VIX spike.

Taking a longer-term perspective, looking out at least one quarter, all fears are usually in the rear view mirror and stocks are likely to have tacked on significant gains.

As noted many times here in the past, the data in this table supports the idea of both short-term and longer-term mean reversion, but calls into question the role of mean reversion in the 10-20 days following a VIX spike, where fundamental factors have a tendency to overwhelm a technically oversold condition in stocks.

Related posts:

Disclosure(s): short VIX at time of writing; the CBOE is an advertiser on VIX and More

Friday, January 31, 2014

VXX and VXZ Now Five Years Old!

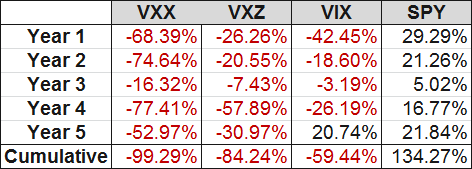
In the midst of all the emerging markets turmoil, I wanted to take a moment to acknowledge the fifth birthday of the two pioneering VIX ETPs : VXX and VXZ. Launched five weeks before stocks hit their 2008-09 financial crisis bottom, both VXX and VXZ have struggled against a tide of falling volatility over the course of the past five years and have also been battered by persistent contango in the VIX futures, which has created additional head winds in the form of negative roll yield.

The table below captures the grim history of these two products, looking at product lifecycle years from January 30th to January 30th:

[source(s): CBOE, Yahoo, VIX and More]

Note that even though each of the five years have been losing years for both products, there have been periods in which these products have been extremely strong performers. One of these periods was from July to October 2011 when VXX nearly tripled (maximum gain of 198%) and VXZ rallied some 66%. I mention this because both have performed well in January, with VXX up 13.0% as I type this and VXZ with gains of 2.2% for the year.

While I am not going out on a limb and predicting a renaissance for these two VIX ETPs, they are two of the most important and liquid VIX ETPs on the market and can be attractive hedges or speculative trades when the markets go through a period of selling and/or there are concerns about a potential crisis.

I have been writing about these even before they were launched and will continue to offer my thoughts on them going forward.

Related posts:

Disclosure(s): short VIX and VXX at time of writing

[source(s): CBOE, Yahoo, VIX and More]

Wednesday, August 14, 2013

Expanded Performance of Volatility-Hedged and Related ETPs

When I recently assembled Top Posts of 2013 (Through First Half of Year), several themes jumped off the page. The top four posts of the year summarize what many investors have been worrying about this year:

  1. The Low Volatility Story in Pictures
  2. Four Years of SPX Pullbacks in One Plot
  3. VIX ETP Performance in 2012
  4. All-Time VIX Spike #11 (and a treasure trove of VIX spike data)

The issues are related to pullbacks in stocks, the VIX spikes associated with them, how to minimize portfolio volatility when these types of events happen and what the implications are for various VIX exchange-traded products.

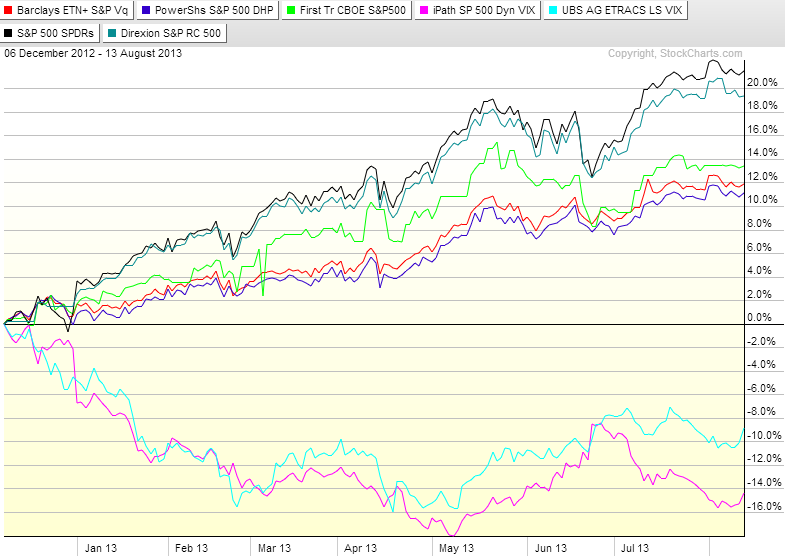
With that backdrop and a stock market that has been looking fatigued while it has meandered sideways for the past month, quite a few investors are thinking about how to hedge a portfolio that has a long-equity bias. In the graphic below, I capture the recent performance of a number of ETPs which may be suitable for hedging that type of portfolio.

[source(s): StockCharts.com]

Interestingly, the performance of these securities appears to fall into three distinct groups.

The top group has two ETPs:

  • SPY (black line), included largely for reference purposes
  • Direxion S&P 500 RC Volatility Response Shares (VSPY), which employs a market timing mechanism that dynamically allocates between stocks and bonds according to measures of market volatility (blue-green line)

The second group contains the core of the VIX-based dynamic hedging products:

  • First Trust CBOE S&P 500 Tail Hedge Fund ETF (VIXH), which is essentially a portfolio consisting of 99-100% of SPY, augmented by a dynamic allocation of 0-1% of VIX options (light green line)
  • Barclays ETN+ S&P VEQTOR ETN (VQT), which has a dynamic allocation of VIX futures that fluctuates based on realized volatility and the trend in implied volatility (red line)
  • PowerShares S&P 500Downside Hedged Portfolio (PHDG), like VQT, has a dynamic allocation of VIX futures and is based on the S&P 500 Dynamic VEQTOR Index (dark purple line)

The bottom group includes two performers:

  • UBS ETRACS Daily Long-Short VIX ETN (XVIX), which is equivalent to a fixed allocation of a 100% long position in VXZ, offset by a 50% short position in VXX. I have included XVIX (aqua blue line) here largely to show how closely the performance corresponds to that of XVZ
  • iPath S&P 500 Dynamic VIX ETN (XVZ), utilizes the slope of the VIX:VXV ratio (SPX 30-day implied volatility to SPX 93-day implied volatility) to determine the dynamic allocation to short-term and medium-term VIX futures. In this case, the allocation to short-term VIX futures (think VXX) can be either long or short, while the allocation to medium-term VIX futures will always be long, though it is variable (fuchsia line)

Keep in mind that the most aggressive hedges are almost always the ones that underperform the most in bullish periods. If you want a very different look at how some of these products perform when stocks decline sharply, check out Performance of VIX ETP Hedges in Current Selloff.

The links below provide some background information on some of these products as well as performance data and should serve as excellent starting points for more comprehensive research.

Related posts:

Disclosure(s): long VQT and short VXX at time of writing

Wednesday, January 30, 2013

VXX and VXZ Celebrate Fourth Birthday

What better way to celebrate your birthday than by ripping off a huge gain. That’s what VXX must have been thinking today as it gained 6.2%, while it’s often overlooked sibling, VXZ, gained 2.2%.

Of course, the last four years have not been kind to these VIX exchange-traded products in the aggregate, but for selected periods, they have been remarkable performers. Just ask anyone who was short VXX when it spiked 198% during a period from July to October of 2011.

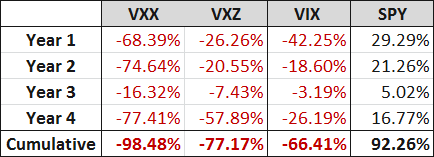
In spite of that impressive short-term performance, both VXX and VXZ have lost ground in each of the four years since their launch. To be fair, though, so did the VIX, if one measures each ‘performance year’ from January 30th.

The table below shows the performance of VXX, VXZ, the VIX and SPY during each of those January 30th performance years. When one considers that in each of those yearly measurement periods the SPY advanced and the VIX declined, it is a little bit easier to swallow the performance of the two pioneering VIX ETPs.

[source(s): Yahoo, thinkorswim/TD Ameritrade, VIX and More]

In spite of some of the concerns expressed about the performance of VXX and VXZ in this space as early as the first half of 2009, VXX is still the #1 VIX ETP in terms of assets at $1.043 billion, while VXZ is in the #8 slot at $57 million.

To reiterate what I have maintained since their launch, VXX and VXZ are products that are suitable for short-term long volatility positions or for longer-term holding periods under certain market conditions. For those who are interested in more information, the links below should provide some excellent jumping off points.

All investors are encouraged to carefully study the prospectus of VXX and VXZ and more generally of all VIX and volatility-based exchange-traded products.  I also strongly encourage potential investors in this space to spend some time learning the intricacies of VIX futures, contango, roll yield and other related subjects.

Related posts:

Disclosure(s): short VXX at time of writing

Sunday, October 21, 2012

The 2012 VIX Futures Term Structure as an Outlier

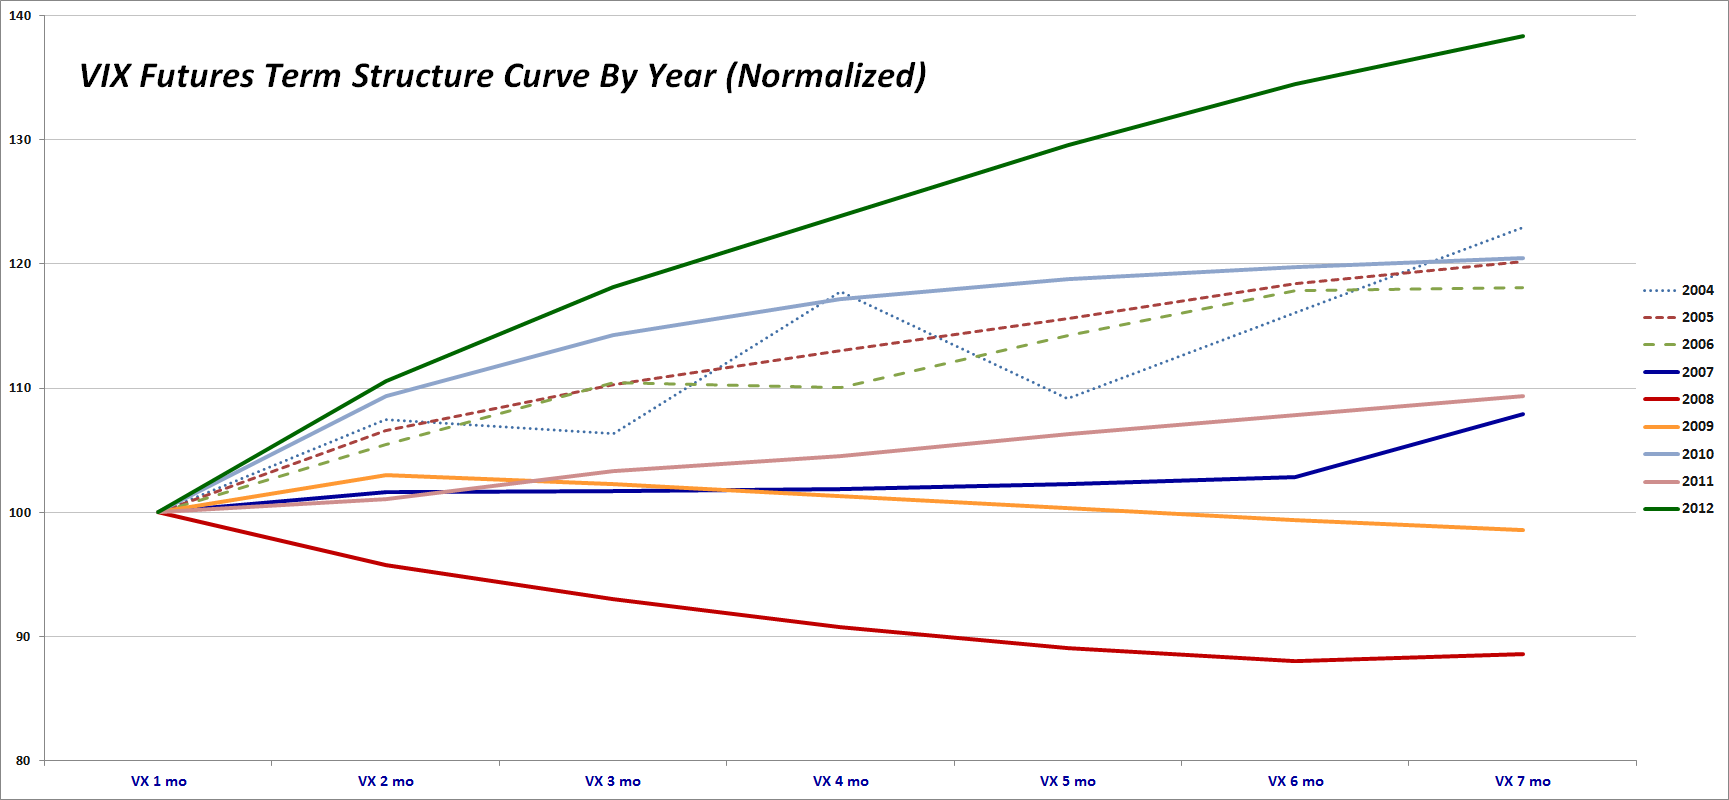
Investors who have been trading the VIX futures, VIX options and VIX exchange-traded products in 2012 have no doubt observed that there has been a wide gulf between the volatility predicted by the VIX front month futures and the back month futures. How wide? Well the graphic below shows the average (mean) normalized term structure for each year since the VIX futures were launched, back in 2004. In normalizing the data, I have set the average front month VIX futures contract to 100 and have expressed the averages of the second through seven months as multiples of the front month.

[Note that while the VIX futures were launched in 2004, consecutive VIX futures contracts for the first six months were not available until October 2006, hence the dotted lines for these years to reflect the erratic nature of the data. Also, I have included the seventh month contract in the calculations because this month is critical to the calculations of a number of VIX ETPs, including VXZ, VIXM, ZIV, etc.]

[source(s): CBOE]

For anyone who has followed the VIX futures closely, it should come as no surprise that 2008 (solid red line) is the only year in which the full VIX futures term structure was in backwardation (front months higher than back months) in aggregate. During 2009 (solid orange line), the term structure transitioned from backwardation to contango (front months higher than back months) and for the most of the balance of its life, the VIX futures term structure has remained in contango.

The graphic shows no discernible trend of extreme contango evolving over the past few years. While 2010 is the year with the second highest degree of contango across the full term structure, contango was decidedly muted during 2011. In fact, 2011 saw the longest continuous stretch of backwardation during the height of the European sovereign debt crisis.

Looking closely at the differences between 2012 and 2010, there is very little difference in contango out to the second month. The normalized term structure curves begin to diverge substantially only after the third month, where the 2010 term structure begins to flatten and the 2012 term structure continues an almost linear ascent. In fact the most distinctive feature of the 2012 term structure is the absence of any significant flattening in the VIX futures curve in months four, five, six and seven. This is part of the reason that while XIV is up 165% for the year, ZIV has managed a gain of 72%.

As this series continues, I will examine some of the possible causes of the recent persistent steep contango in the VIX futures term structure, particularly in some of the back months.

Posts in current series on VIX futures:

Related posts:

Disclosure(s): long XIV and ZIV at time of writing

Thursday, August 16, 2012

A VIX Risk Reversal

With the VIX at about 14.50 as I type this and a large group of investors convinced that stocks are overbought and/or not properly discounting global macro risk, many are wondering just how to translate their beliefs into an effective trading strategy.

For those who think a long volatility trade is the answer, there is the issue of the significant contango headwinds, where a negative roll yield will pummel net asset values on VIX options and VIX exchange-traded products as a part of the daily rebalancing process, while VIX futures are subjected to a similar decay that reminds me a little bit of a dying helium balloon. Long story short: there is a huge daily penalty being assessed just for holding these long positions.

There are ways to minimize the effect of negative roll yield and typically one of the best of these is to work with positions that focus on the more distant months of the VIX futures term structure. This is generally why VXZ outperforms VXX over an extended period. Unfortunately for aficionados of VXZ, the negative roll yield between the fourth and seventh month VIX futures (VXZ buys the seventh month and sells the front month each day) hit a new record on Monday and continues at near record levels.

So what is a long volatility trader to do?

One trade that I somehow have never managed to highlight in my 5 ½ of writing about the VIX is a VIX risk reversal. A risk reversal is essentially a synthetic long position in which a trader uses options to create a position that is similar to owning the underlying, but typically ties up less capital in the process. In the case of a risk reversal, this means selling out-of-the-money puts and buying out-of-the-money calls. In many instances, the sale of the put options will finance 100% of the cost of the calls.

While the VIX is currently trading at 14.50, keep in mind that the best proxy for the price of the underlying for VIX options is the VIX futures for the corresponding month. So, with the September VIX futures at 18.95 at the moment, one could sell the September 18.00 puts for 1.50 and buy the September 24 calls for 1.05, pocketing the 0.45 differential. A more conservative trader might look to sell the VIX September 16 puts for 0.55 and use the proceeds to pick up a September 30 call for 0.55 or to defray some of the costs of the purchase of a more expensive call, such as the September 24 (priced at 1.05) mentioned above.

There are ways to turn this idea into a more aggressive trade as well. One approach is to morph a risk reversal into a leveraged trade in which more calls units are purchased than put units are sold. An example of this approach might involve selling the September 19 puts (which are currently at-the-money) for 2.15 and using the proceeds to purchase two contracts of the September 24 calls for 1.05 each.

A risk reversal also goes by other names, notably a long combination (or long combo) and, despite the name, is a high-risk trade that is vulnerable to the ravages of time decay. This trade is not for everyone, but can be a good way to generate significant long exposure with a minimal outlay of funds and sometimes no outlay of funds at all.

Related posts:

Disclosure(s): long VIX at time of writing

Tuesday, April 10, 2012

Performance of VIX ETP Hedges in Current Selloff

It was only a week ago that I discussed the performance of 31 VIX and volatility-based exchange-traded products in VIX ETP Returns for Q1 2012 and barely a month ago that I examined in some detail the workings of two VIX ETPs, VQT and XVZ, in Dynamic VIX ETPs as Long-Term Hedges. When stocks fall and volatility rises, however, which VIX ETP hedges work the best?

The answer is not so simple, unless you know when volatility will begin to spike, how far it will go and how long it will take to get there. Even then, it would still be helpful to know what happens to the VIX futures term structure along the way.  Also, there are liquidity constraints that will probably limit the choices for most investors to a half dozen or fewer alternatives.

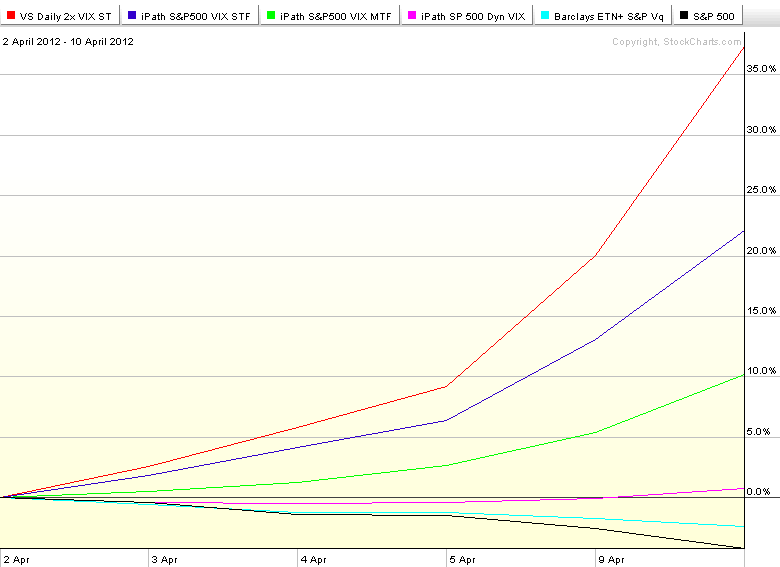
That being said, the current selloff can be used to highlight some important heuristics and alternative approaches. The first graphic below, for instance, illustrates the performance since the April 2 close of five representative and relatively liquid VIX ETPs (TVIZ was excluded on the grounds of liquidity; its performance during the period was similar to that of VXX) that can be used as hedges. For the most part, the performance trend is the opposite of what was observed during the first quarter.

The three fixed allocation VIX ETPs have been excellent performers during the last five trading days. With +2x leverage and a short-term (weighted average of one month) maturity, TVIX (red line) was the standout in the group. The second best performer during the selloff was VXX (blue line), a +1x short-term product.  The +1x mid-term (weighted average of one month) maturity VXZ (green line) ETP has also been a strong performer, certainly worthy of a bronze medal. All three hedges have gained more than 10% during the last five trading days, while the S&P 500 index (black line) has fallen 4.3%. In sharp contrast to their fixed allocation brethren, the two dynamic allocation VIX ETPs have both hovered around the unchanged line during the selloff, with XVZ (fuchsia line) eking out a small gain after a small bounce today, while VQT (aqua blue line) has posted a loss during the same period.

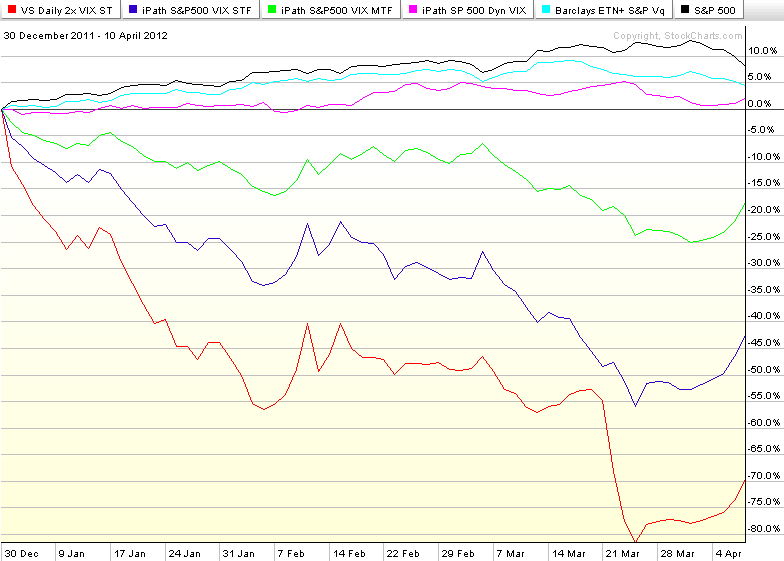
Obviously, anyone who bought TVIX (or VXX or VXZ) on April 2 is sitting on a nice profit, but the second graphic, which tracks performance of the same ETPs since the beginning of the year, lays out the big picture conundrum succinctly. In short, the most responsive hedges (TVIX, VXX, etc.) are those which have a fixed allocation and are most susceptible to losses due to contango and negative roll yield while one is waiting for a hoped-for VIX spike to materialize. The dynamic allocation VIX ETPs, on the other hand, are tweaked to minimize losses due to contango and negative roll yield and thus can be left in place for extended periods, but there is enough lag time built into their dynamic allocation rules so that they offer little protection from sudden and short-lived VIX spikes, while doing a better job of protecting portfolios during extended periods of volatility, such as the peak of European sovereign debt crisis during August-September 2011.

So…if you know when the fireworks are going to start, TVIX and VXX are excellent choices as volatility hedges for long equity portfolios. If the timetable is uncertain (which is often the case) and the goal is to protect against a period of extended high volatility, then VXZ and VQT are likely to be more compelling alternatives.

Related posts:

[source(s): StockCharts.com]

Disclosure(s): long XVZ; short VIX, VXX and TVIX at time of writing

Tuesday, March 27, 2012

VXX, VXZ, XIV and ZIV During Eleven Months of a Sideways VIX

The VIX closed at 15.59 today, just 0.03 points lower than the close of 15.62 on April 26, 2011, some eleven months ago.

From a long-term perspective, not much has happened with the VIX, but for those who have ridden the volatility roller coaster up and down, the present time seems like an excellent opportunity to reflect on where the ride has taken us.

For those who have traded VIX exchange-traded products (ETP) during the last eleven months, the ride has been much different than that of the VIX itself, an issue I highlighted in VIX Exchange-Traded Products: The Year in Review, 2011, when I concluded, “While it is interesting that both the long and short volatility ETPs were unable to turn a profit for the year, there were stretches during 2011 that various VIX ETPs produced extraordinary gains.”

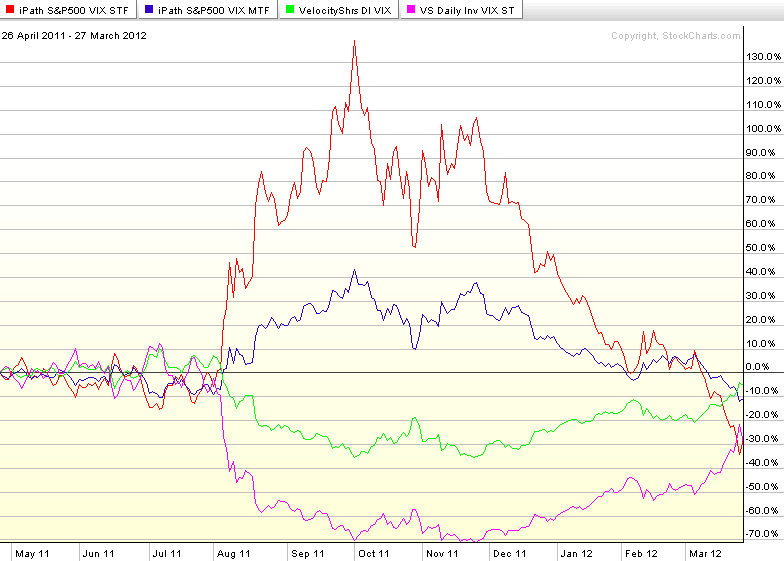
In the graphic below I have highlighted the performance of four popular VIX ETPs that are the most actively traded issues among the several that occupy a competitive space with a similar leverage factor and weighted average maturity (see Slicing and Dicing All 31 Flavors of the VIX ETPs for additional details):

  • VXX – iPath S&P 500 VIX Short-Term Futures ETN (red line)
  • VXZ – iPath S&P 500 VIX Mid-Term Futures ETN (blue line)
  • ZIV – VelocityShares Daily Inverse VIX Medium-Term ETN (green line)
  • XIV – VelocityShares Daily Inverse VIX Short-Term ETN (violet line)

Note that while the VIX traded sideways, all four VIX ETPs lost money, with the worst losses being incurred by VXX, which was down 28% during this period.

Not surprisingly, the two ETPs with the five-month target maturity (VXZ and ZIV) were considerably less volatile than their one-month target maturity counterparts.

There are a number of potential takeaways here, but perhaps the biggest of these is that VIX ETPs will struggle to outperform the VIX over longer-term time horizons. For these trades to be profitable, proper market timing is of the essence, as is the ability to take profits and/or cut losses when the trade starts to move sharply in the wrong direction.

Related posts:

[source(s): StockCharts.com]

Disclosure(s): long XIV and ZIV, short VXX and VXZ at time of writing

Friday, March 2, 2012

Dynamic VIX ETPs as Long-Term Hedges

With the huge contango in the VIX futures term structure at the moment, anyone who is buying VIX options or the VIX exchange-traded products (ETPs) right now is having to pay for that contango in order to have the opportunity to capitalize on increasing volatility. With the contango-based negative roll yield currently running at 15% per month, this means the cost of a volatility hedge for long equity positions is extremely expensive in the current market.

Fortunately, investors do have some alternatives that have a different type of appeal.

There are two VIX ETPs, VQT and XVZ, which attempt to minimize the impact of the negative roll yield by using a market timing mechanism that dynamically adjusts the long volatility exposure. In more volatile markets, the exposure increases; in less volatile markets, the long volatility exposure is either very low (in the case of VQT) or can even flip to a small net short position (in the case of XVZ).

VQT is more of a portfolio replacement strategy, while XVZ is more of a portfolio augmentation strategy. Specifically, VQT has long SPY exposure that ranges from 60% to 97.5% of its portfolio, with the balance (2.5% - 40%) allocated to a long position in the VIX short-term futures (think VXX). The links below will provide more details.

XVZ, on the other hand, does not hold any long equity component, only short-term (again, think VXX) and mid-term (think VXZ) VIX futures. The twist here is that while the mid-term VIX futures component can range from 50-100% of the portfolio, the short-term component can be as high as 50%, but as low as negative 30%. So…under certain circumstances (e.g., a very steep VIX futures term structure, like the one we are currently experiencing), the portfolio will consist of the equivalent of a 30% short position in VXX and a 70% long position in VXZ. On balance, that type of portfolio should be very close to volatility neutral and in some cases even have a slight short volatility bias.

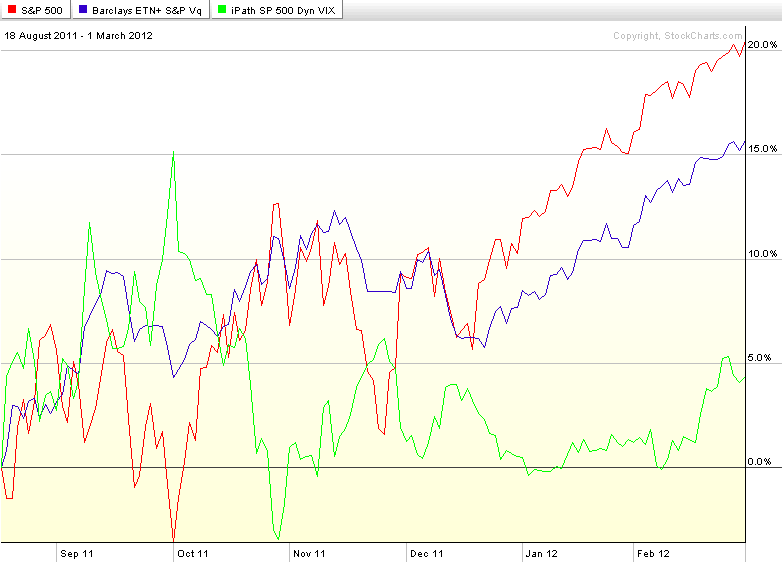
Since XVZ was only launched on August 18, 2011 (VQT dates back to September 2010), I have chosen a graphic that shows the relative performance of the SPX (red line), VQT (blue line) and XVZ (green line) from the launch of XVZ to the present. Note that with its long exposure, VQT is better able to take advantage of a low volatility slow bull market. XVZ, on the other hand, is generally close to flat in a low volatility bull market, but should the VIX spike sharply higher, XVZ will likely do a better job of capitalizing on the volatility spike.

As investors ponder the fatigued bulls and inevitable pullback sometime in the near future, certainly VQT and XVZ warrant a more detailed investigation, along with some of the non-volatility ETPs that are meant to reduce risk and hedge against a downturn, such as VSPY, SPLV, and others.

Related posts:

[source(s): StockCharts.com]

Disclosure(s): long XVZ and short VXX at time of writing

Monday, January 30, 2012

A Monthly Comparison of VXX and VXZ

Three years after their launch, VXX has about four times as many assets as its mid-term sibling, VXZ. When it comes to public relations and media column inches, I imagine the ratio is more like 50-1 in the favor of VXX. In many ways VXZ is the unloved stepchild of the duo.

I recently opined that when it comes to the inverse variants of these two ETPs, ZIV is Undeservedly Neglected. I believe the same case holds for VXZ. One of the great difficulties in trading VIX-based ETPs is that while the potential returns are enormous, when things move in the wrong direction, a bad trade can spiral out of control and trigger an extremely painful loss with surprising speed. This is a large part of what makes VXZ more attractive than VXX. Even though VXZ is relatively volatile, with a current 30-day historical volatility of 39.5, it pales in comparison to the 70.1 30-day HV of its rocket-fueled short-term brother, VXX. In this case, the slower the train wreck, the more easily it can be avoided and position risk becomes much more manageable.

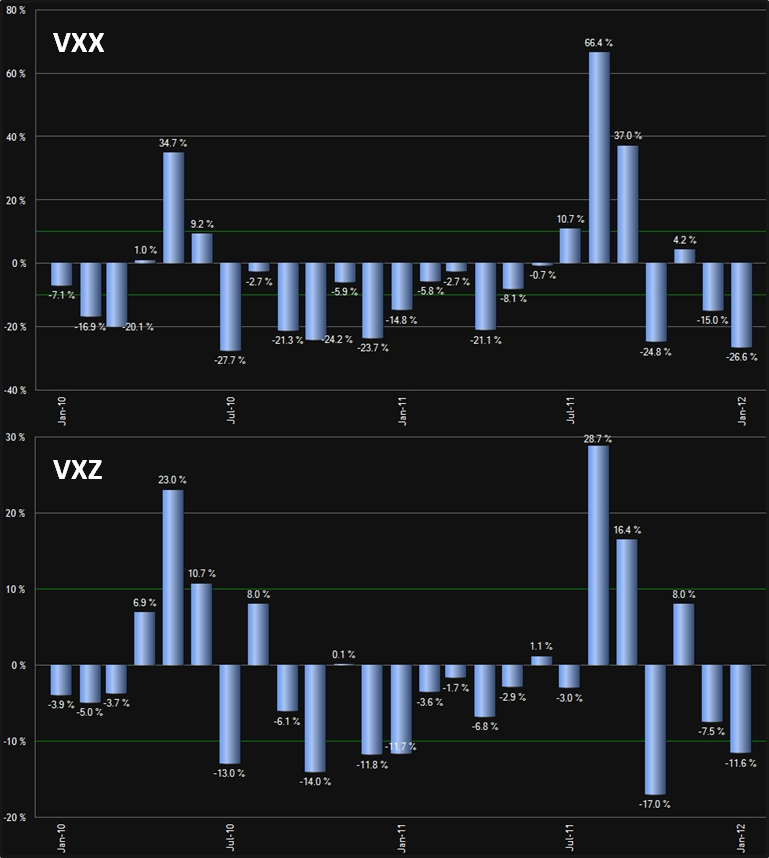
In addition to the lower volatility, VXZ is also much less susceptible to the contango and roll yield issues that plague VXX. In fact, on average VXZ is only subjected to about 1/3 of the negative roll yield that impacts VXX, which is a large part of the reason why the long-term performance of VXZ is much superior to the numbers put up by VXX. To illustrate this point, the chart below shows the month-by-month performance data for VXX and VXZ going back two years.

In summary, if you are impatient and you like action, VXX is the better bet, but if you have some patience and want better odds, VXZ is often a better long volatility play.

Related posts:

[source(s): ETFreplay.com]

Disclosure(s): long ZIV and short VXX at time of writing

VXX Celebrates Third Birthday

It does not seem too long ago that I was the only person who thought VXX was worth mentioning.

Known formally as the iPath S&P 500 VIX Short-Term Futures ETN, VXX was launched three years ago today, alongside of its sibling, the iPath S&P 500 VIX Mid-Term Futures ETN, VXZ. Together these were the first VIX-based exchange traded product to be hit the market.

I have discussed in detail in this space the factors driving the performance of VXX (VIX futures, contango, roll yield, etc.) and the underlying causes of the persistent underperformance of VXX.

To bring the accounting up to date, VXX was down 68.4% in its first year, then lost 74.6% in its second year. During its third year of trading, VXX fared much better, but still managed to decline 18.6%. Of course there were pockets of excellent performance (notably a 66.4% jump in August, as the graphic below outlines), but over the course of a full year, the roll yield drag was more than the volatility spikes were able to overcome. In fact, VXX is now down 94% from its split-adjusted launch price.

Even with the above facts, it is still possible to trade VXX successfully from the long side, particularly if one keeps the holding periods as brief as possible and/or pays close attention to the VIX futures term structure.

Related posts:

[source(s): ETFreplay.com]

Disclosure(s): short VXX at time of writing

Friday, January 20, 2012

ZIV Undeservedly Neglected

Much to my amazement, next week will mark the third anniversary of the launch of the first two VIX ETPs: the S&P 500 VIX Short-Term Futures ETN (VXX) and the S&P 500 VIX Mid-Term Futures ETN (VXZ).

Some may recall that investors were slow to warm up to these ETNs (see Charting the Assets of Volatility-Based ETPs), but these two products are now #1 and #5 in the very successful volatility ETP space, with assets of $700 million and $188 million, respectively.

It is no secret that VXX has always been the darling of short-term traders, while VXZ has struggled at times to find a broad audience. As investors have become better educated about the influence of the VIX futures term structure and resulting roll yield on returns, interest in VXZ relative to VXX has picked up, but the latter, with its target maturity of five months, continues to play second fiddle to its short-term (one month target maturity) sibling.

I was curious see how this dynamic played out when VelocityShares rolled out two products that are essentially the inverse of VXX and VXZ in November 2010. Once again the short-term product captured the bulk of the interest of traders, as XIV quickly established itself as the #2 product in the VIX ETP space. While the love for XIV is certainly understandable, due to the history of persistent contango and negative roll yield in VIX futures, this product suffered a huge drawdown as the European sovereign debt crisis and resulting record backwardation wiped out 75% of the ETPs value from July through November 2011.

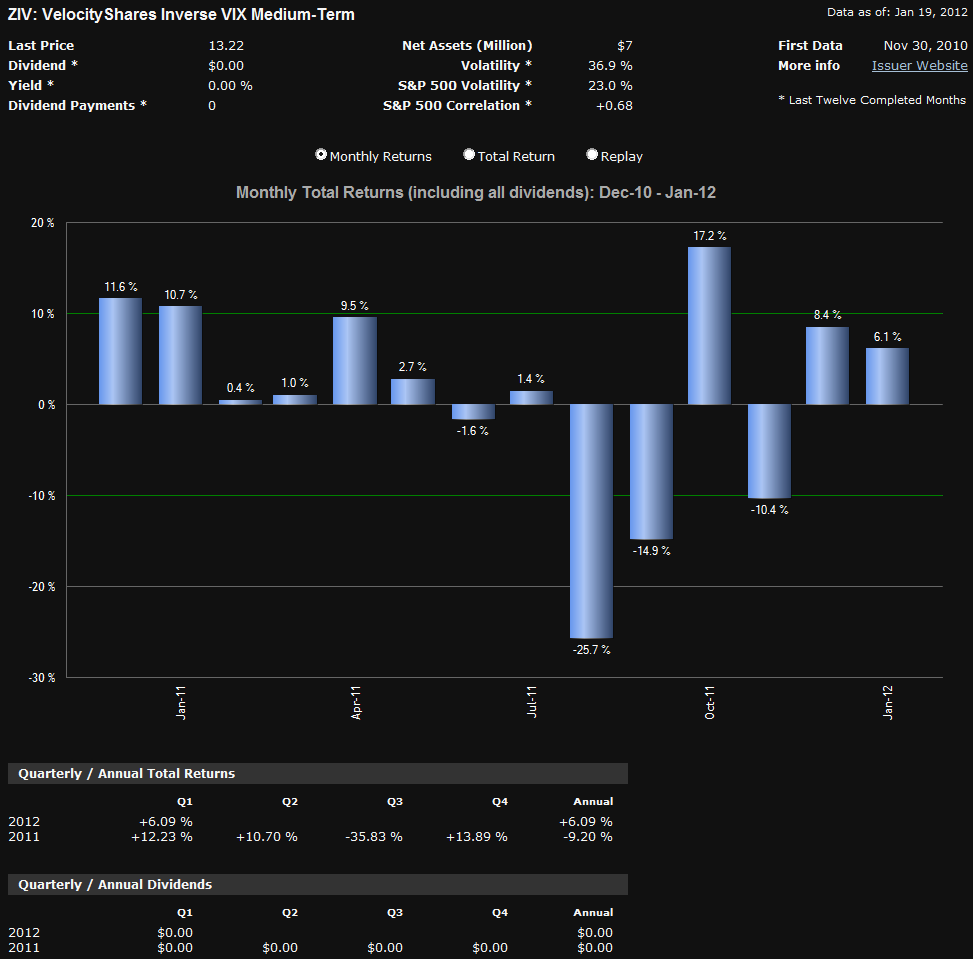
Against this backdrop, I am frankly surprised by the lack of interest investors have shown in ZIV, the VelocityShares Daily Inverse VIX Medium-Term ETN. In a nutshell, ZIV has many of the same benefits of long XIV and/or short VXX positions, with much less risk. Specifically, ZIV benefits from negative roll yield about 65% of the time, with VIX futures data going back to 2004 indicating that the annual benefit due to negative roll averages out at more than 20% per year. With XIV getting all the attention, I wonder if investors are aware that XIV is down and ZIV is up since the two products were launched.

Of course, like XIV, ZIV is exposed to sharp spikes in the VIX, as the chart below reflects. It is worth noting, however, that when the VIX spikes, ZIV can be expected to lose value at about half the rate of losses in XIV. For example, while XIV was falling 75%, ZIV was down 42%.  It bears repeating that one of the key features of inverse volatility products is that the potential for large short-term losses is significant, even though the long-term prospects are promising.

Finally, for those who are investing in or trading VIX-based ETPs, it is important to keep in mind that short-term returns are most likely to be a function of changes in the VIX and VIX futures, while long-run returns will be dominated by the VIX futures term structure.

Related posts:

[source(s): ETFreplay.com]

Disclosure(s): long XIV and ZIV, short VXX at time of writing

Saturday, January 14, 2012

Five Years of VIX and More

One week ago marked five years since my first post at VIX and More. Since this anniversary fell just after my Top Posts of 2011 entry, it seemed like another retrospective look at the blog might be one too many. After a week of reflection I am now convinced that The 1000th Post is probably best left unchallenged (for now at least) as my definitive history of the ideas represented on this blog and a good reference for relatively new readers. Another link worth highlighting is the hopefully self-explanatory The Post of the Month: An Informal History of VIX and More. Last but not least, for those interested in the best of the archives, those few posts with the hall of fame label are among my personal favorites.

In order to mark the five-year anniversary, I have elected to highlight the ten most-read posts on the blog since its inception, with some commentary about each post.

  1. Ten Things Everyone Should Know About the VIX – If there is one post on this blog that everyone could benefit from – and new readers might wish to start with – this is the one. I last updated the contents of this post in 2010 and I will be sure to revise it again in the near future.
  2. How to Trade the VIX – This is a fairly basic explanation about how to trade the VIX that probably benefits from having a title that positions it well for Google searches. There are a number of related posts about how to trade the VIX (some of which are links in the original), but here is a case where I should also have an updated look at the subject, with some more comprehensive information.
  3. VXX Calculations, VIX Futures and Time Decay – I find it interesting that a post which was unable to crack the top ten in the year it was written (2009) is now in the top three of all time. I believe this was the first explanation anywhere went into the details of the VIX futures roll yield and the math involved persistent contango and the resulting price decay in VXX. As so many traders have taken up the cause in trading VXX and related products, this post has become an invaluable educational resource and is frequently linked to almost three years later.
  4. Why VXX Is Not a Good Short-Term or Long-Term Play – Written several months after the post above, this extended some of the ideas that I had fleshed out earlier in a manner that investors have found helpful regardless of the time frame in which they are trading.
  5. Prediction: Direxion Triple ETFs Will Revolutionize Day Trading – One thing I tried to do when I started this blog was to focus on educational material instead about talking about my trades or what I was expecting from the markets. Every once in a while, however, there were some things that I saw as very likely to happen that cut against traditional thinking. This triple ETF call was one of those and also helped to attract attention to these new products.
  6. Chart of the Week: Might Recent Volume Bottom Doom Stocks? – I was surprised to see this post on the last as the analysis is probably not among my best thinking. What I believed happened was that at the time this was written, investors had become concerned that stocks had rallied too sharply off of their March 2009 lows and were likely to run out of steam soon. As it turns out, stock sold off for about two weeks after this post, falling back to SPX 869, then resumed their bullish momentum.
  7. What Is High Implied Volatility? – This post from 2008 helped to explain several different ways of evaluating implied volatility relative to various benchmarks, at a time when investors were becoming increasingly concerned about volatility. Questions about implied volatility continue to be big issues for new options traders.
  8. SPX 15% Over 200 Day Moving Average for First Time in Ten Years – While I will probably never get a job writing headlines for the New York Post, every once in a while my research and analysis uncovers something that has widespread appeal and a catchy enough headline to attract a lot of attention. While this headline and the accompanying graphic sound ominous, stocks shook off the bearish warning and continued to rally.
  9. Rule of 16 and VIX of 40 – When people try to explain to me why they like the blog, what usually comes out is some sort of variation of, “You make very technical material easy to understand.” This post is probably one of the better examples of this. Many people struggle with some of the math associated with the VIX and having read this, I know the lights have gone for a number of investors.
  10. Lost in Translation: VXX and VXZ – This post preceded #3 and #4 on this list and  was probably the first piece published anywhere that talked about the beta of VIX, VXX and VXZ relative to SPX. Most investors had not figured out what to expect with VXX and VXZ in terms of VIX moves back in April 2009 – and quite a few still struggle with this issue to this day.

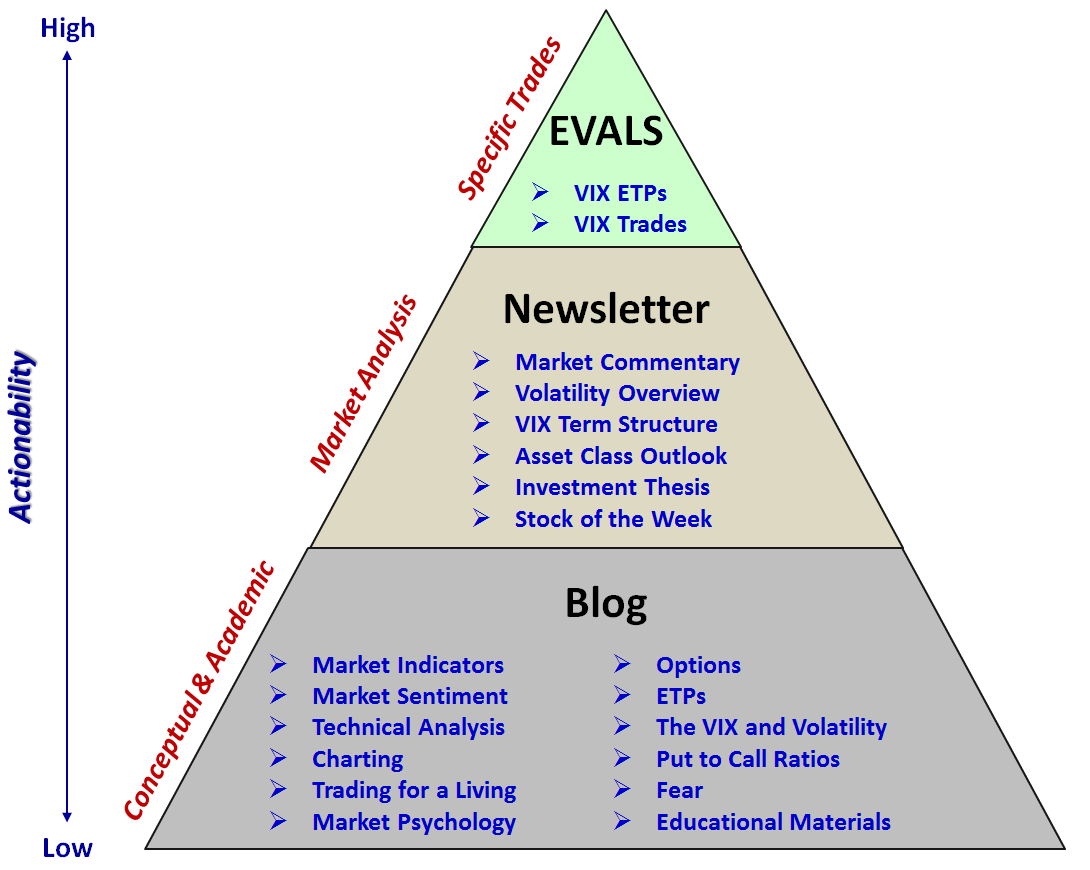
Finally, one recent development worth noting is the re-launch of EVALS (ETP Volatility Analysis Long-Short) in November. EVALS is now focusing on VIX-based ETPs and this has created some confusion from readers about what content is on the blog, what is in the newsletter and what is in EVALS. For this reason, I have created a content pyramid below which should help to differentiate between what can be found where. Of course the blog is free to all, while the newsletter and EVALS are available only to subscribers.

Related posts:


Disclosure(s):
short VXX at time of writing

Friday, November 18, 2011

Interview at OptionPundit

Earlier this week, OptionPundit published the transcript of a recent interview: Bill Luby Talks to OptionPundit.

The interview touches on a wide range of subject, but with an emphasis on the VIX and VIX-based ETPs, such as VXX, VXZ, XVIX. As always, VIX futures and the VIX futures term structure are a critical part of this discussion.

Related posts:

Disclosure(s): long VXZ and short VXX at time of writing

Sunday, February 27, 2011

Chart of the Week: Flight to Safety ETPs

It has already been an interesting year for students of market sentiment, volatility and geopolitical influences on financial markets. We have seen revolutions of various sizes and shapes in the likes of Tunisia, Egypt and Libya, with smaller uprisings in Bahrain, Algeria and elsewhere in North Africa and Middle East. For the most part, volatility in the equity markets has been rather muted prior to the Libyan revolution and its influence on crude oil prices.

In this week’s chart of the week, I examine the year-to-date performance of five exchange-traded products (ETPs) that are central to the flight-to-safety trade. They include volatility (VXX), gold (GLD), oil (USO), the dollar (UUP) and U.S. Treasuries (TLT).

Note that with the exception of crude oil, the political unrest in North Africa and the Middle East has not been disruptive enough to make these trades profitable ones in 2011, though there has been an uptick across the board since violence heated up in Egypt on January 25th and in Libya starting on February 15th. The VXX chart does an excellent job of capturing the nature of the VXX gambit. Even with the geopolitical turmoil and spike in crude oil prices, this ETN is still down 16.2% on the year. The volatility spikes have provided VXX longs with very short-lived opportunities to capitalize on heightened market anxiety, with the chart reflecting the continued downward trend and high volatility in this ETN. [As an aside, a similar chart swapping VXZ for VXX would show very little difference in terms of performance.]

So the next time you think about a long volatility position in the context of a geopolitical crisis, give some strong consideration to some alternative flight-to-safety plays.

Related posts:


[source: ETFreplay.com]

Disclosure(s): long VXZ, short VXX, USO and TLT at time of writing

DISCLAIMER: "VIX®" is a trademark of Chicago Board Options Exchange, Incorporated. Chicago Board Options Exchange, Incorporated is not affiliated with this website or this website's owner's or operators. CBOE assumes no responsibility for the accuracy or completeness or any other aspect of any content posted on this website by its operator or any third party. All content on this site is provided for informational and entertainment purposes only and is not intended as advice to buy or sell any securities. Stocks are difficult to trade; options are even harder. When it comes to VIX derivatives, don't fall into the trap of thinking that just because you can ride a horse, you can ride an alligator. Please do your own homework and accept full responsibility for any investment decisions you make. No content on this site can be used for commercial purposes without the prior written permission of the author. Copyright © 2007-2023 Bill Luby. All rights reserved.
 
Web Analytics