Crazy VIX:VXV Ratio Chart
There was a point in the history of VIX and More that I gave serious consideration to a regular feature in which I unveiled “Strange and Unusual Charts” that presumably had, apart from their novelty, the ability to shine some new light on at least one corner of the investment universe. That being said, I have always had an affinity for presenting charts that show unusual ratios, non-standard time frames and such and while the likes of Chart Porn and Unusual Chart of the Month: VXO and RVX did get me started down a slippery slope, I never quite fell into the habit of tilting wildly at windmills on the plains of StockCharts.com and their brethren.
One rabbit hole that I was definitely the first down and pursued the most aggressively was the VIX:VXV ratio, which one blogger insisted was sure to ultimately be my investing legacy. In all fairness, for the first year following the launch of VXV (essentially a 93-day version of the VIX), the VIX:VXV ratio performed as if it was going to make all other indicators obsolete. Of course, then the financial crisis of 2008 hit and the ratio began sprouting warts all over. While I talk about the VIX:VXV ratio only rarely in this space nowadays, the general idea of which the VIX:VXV ratio is just one instance of what has become one of the main themes of this blog: the idea that an understanding of the VIX futures term structure is critical to understanding the valuation of and trading opportunities available for all VIX products, including futures, options and exchange-traded products.
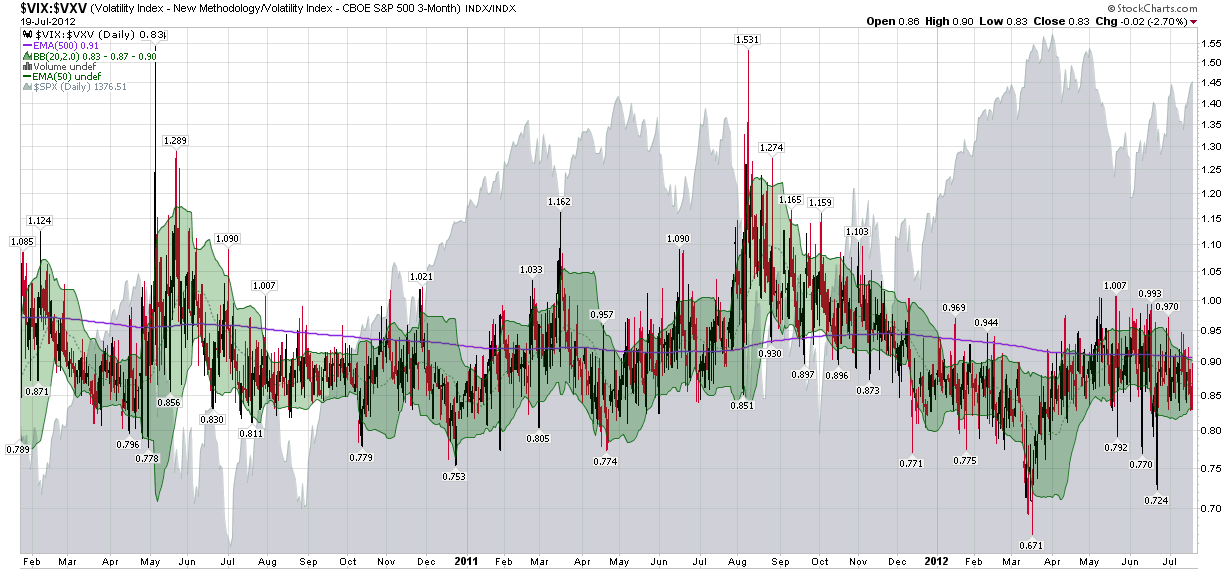
All of which brings me – somewhat belatedly, perhaps – to today’s chart, which is right out of the same cauldron that produced some of the curiosities of yesteryear. The chart below captures 2 ½ years of daily bars in the VIX:VXV ratio and adds some green Bollinger bands for color and context, along with a gray area graph of the SPX. Finally, I have included a purple line for the VIX:VXV ratio that reflects a 500-day exponential moving average (EMA) in order to show the long-term average of the ratio.
While there are many interesting nuggets buried in this chart, first note that the long-term average of the VIX:VXV ratio is not 1.00, but generally hovers in the 0.90 – 0.95. This reflects the fact that the VIX futures term structure has historically been in contango (upward sloping, with nearer months less expensive than more distant months) 75-80% of the time. Second, note that spikes in the ratio tend to coincide with bottoms in stocks and vice versa. Finally, note that even with the crazy VIX spike last August and September (and record backwardation, i.e. high VIX:VXV ratios), the ratio has been depressed since December and the 500-day EMA is now making all-time lows.
What does this mean? Lots of things, but in simple terms investors continue to believe that the VIX is unnaturally low given the scope and magnitude of the future threats to equities. Should the ratio continue at its current 0.83, I would be very concerned about the possibility of a bearish reversal.
[In order to keep this post to a manageable length, I have skipped over a bunch of related issues, but readers should feel free to wander down some of the same rabbit holes I have preserved in the links below.]
Related posts:
- VXV Heralding a Return to Normalcy
- Chart of the Week: VXV at Critical Juncture
- Take a Longer View on Volatility (Barron’s)
- Chart of the Week: VXV and Systemic Failure
- The VXV and Extreme Structural Volatility Risk
- VXV Is One Year Old
- The VIX, VXV and Volatility Expectations
- How to Create Your Own Portable VXV
- Thinking About VXV
- VIX Sets Two New Records
- A Conceptual Framework for Volatility Events
- The VIX:VXV Ratio, Availability Bias and Disaster Imprinting
- The VIX, VXV and Volatility Expectations
- The VIX:VXV Ratio
- Chart Porn
- Unusual Chart of the Month: VXO and RVX
- The 1000th Post
[source(s): StockCharts.com]
Disclosure(s): long VIX at time of writing

