Chart Porn
If I had tried a little harder, I’m sure I could have come up with a better title for this post, but something like “Strange and Unusual Charts You are Guaranteed Not to Find Anywhere Else” and their ilk seemed like too much work.
So let me summarize the current market situation, if I can. Essentially, almost all the momentum and support/resistance charts say that a bear curtain has descended upon the markets. On the other hand, Panglossian types are still able to find solace in the fact that some oscillators suggest that the recent moves down have been excessive. Additionally, they can always change the moving averages on their charts from days and weeks to months in order to support their contention that the markets are in the midst of pulling back to support. At this stage, deciding which camp has the most like-minded souls has as much to do with one’s philosophy and outlook as it does the result of rigorous analysis.
In the end, it’s quite possible that none of this matters. As one commenter from yesterday suggested, perhaps the only things that do matter are what the bearded man sings and how mellifluously it falls on our ears (that and perhaps whether he is a baritone or a castrato.) Hint: if it’s Das Lied von der Erde, I’m buying gold.
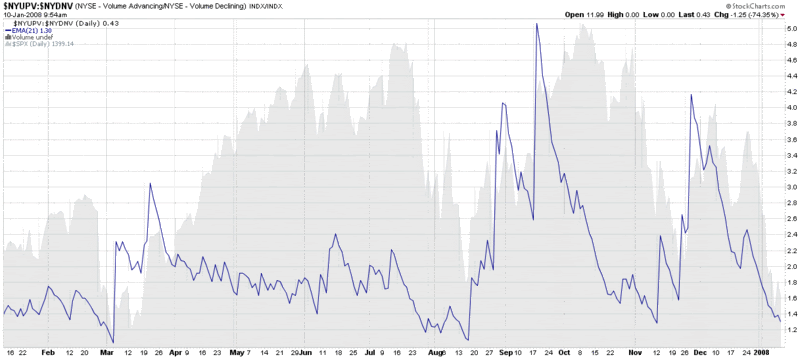
But enough silliness for now. Getting back to some chart porn, I am including the chart below not so much because the conclusions are fresh (“things are bad” or “things are about to turn,” depending upon your perspective), but because I’m fairly sure you cannot find this chart anywhere else. The chart tracks the ratio of up volume to down volume for the NYSE and uses a 21 day EMA to smooth the data. The NASDAQ version of the data looks similar, but this NYSE chart shows the potential for volume data to help call both tops and bottoms in advance. So dial up some Mahler and watch the volume.


3 comments:
I use a similar chart all the time.... http://follow-the-trend.blogspot.com/2008/01/more-downside.html
It's actually quite accurate, those lows on that chart correspond to lows in the market.
Hi there! I realize this is sort of off-topic but I needed
to ask. Does managing a well-established website like yours require a massive amount work?
I'm brand new to operating a blog however I do write in my journal every day. I'd like to start a blog so I can easily share my experience and views online.
Please let me know if you have any kind of suggestions or tips for
brand new aspiring bloggers. Thankyou!
Stop by my web page free teenage porn sites
pop over here replica bags from china free shipping sites replica chanel bags ebay about his replica bags online pakistan
Post a Comment