Showing posts with label backwardation. Show all posts

Tuesday, May 2, 2017

Euro Zone VSTOXX ETNs Land on U.S. Beaches!

Think the market is too complacent about this weekend’s election in France?  Worried that the euro area is going to crumble under the weight of Italy’s struggles?  Convinced that Greece, Portugal or Spain are just one more kicked can away from a disaster?

As of tomorrow, investors in the U.S. will have another way to translate these ideas into actionable trades with tomorrow’s launch of two new exchange-traded notes (ETNs) – EVIX (long euro zone volatility) and EXIV (inverse euro zone volatility) – from VelocityShares and UBS that put a European face on existing U.S. VIX-based products such as VIIX and perennial favorite XIV.

Based on the VSTOXX, the VIX-like volatility index for the EURO STOXX 50 Index of 50 blue-chip stocks from 11 euro zone countries, EVIX and EXIV should be familiar to those who are knowledgeable about VXX and VIIX on the long volatility side as well as XIV and SVXY on the short volatility side.  EVIX and EXIV are based 
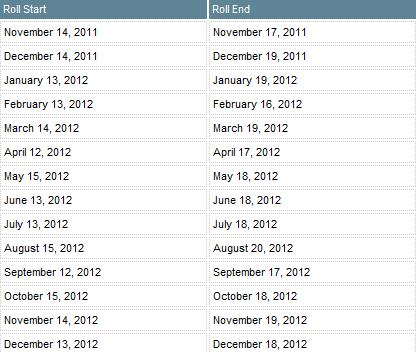
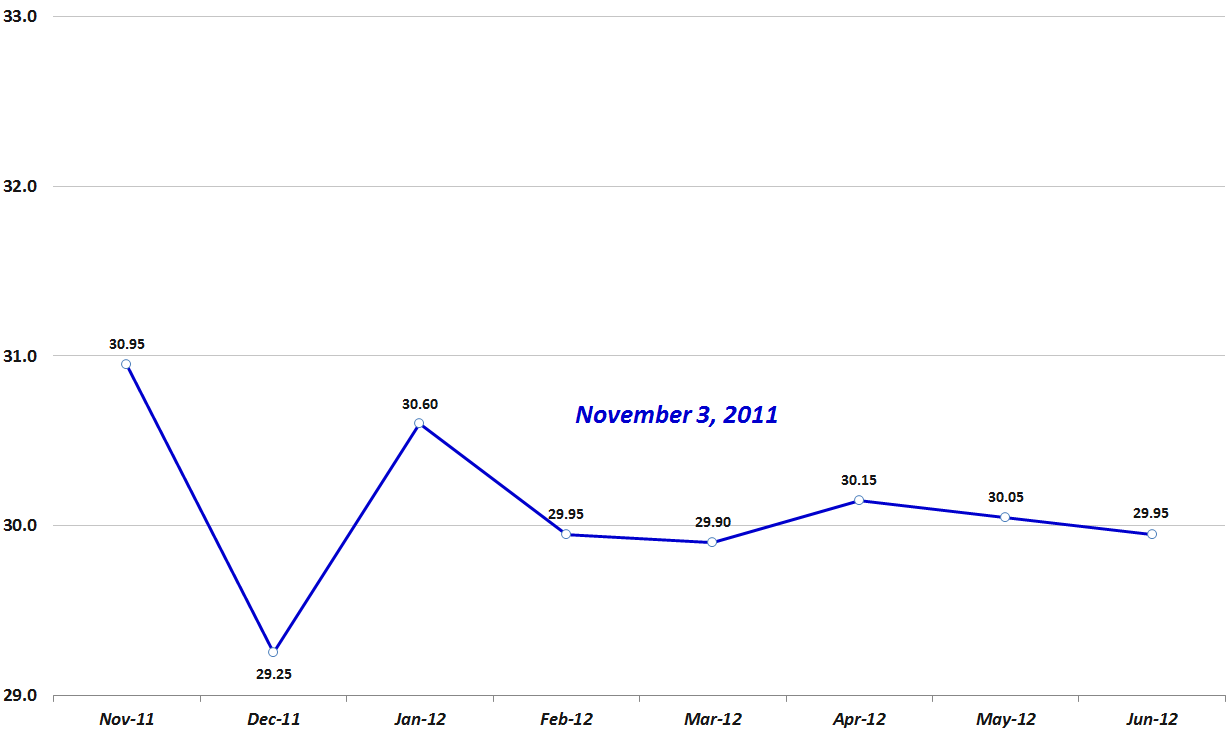
on VSTOXX futures and have a target maturity of 30 days – a maturity that is maintained by rolling a portion of the portfolio each day and therefore subjecting 
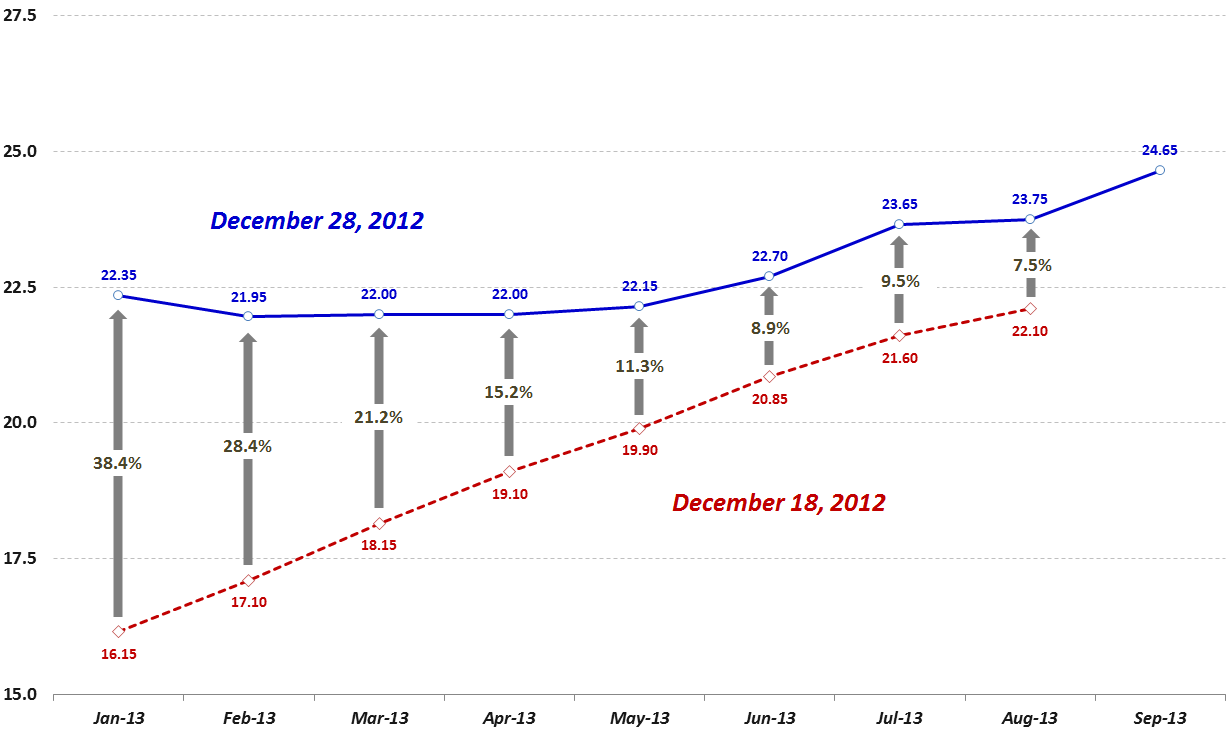
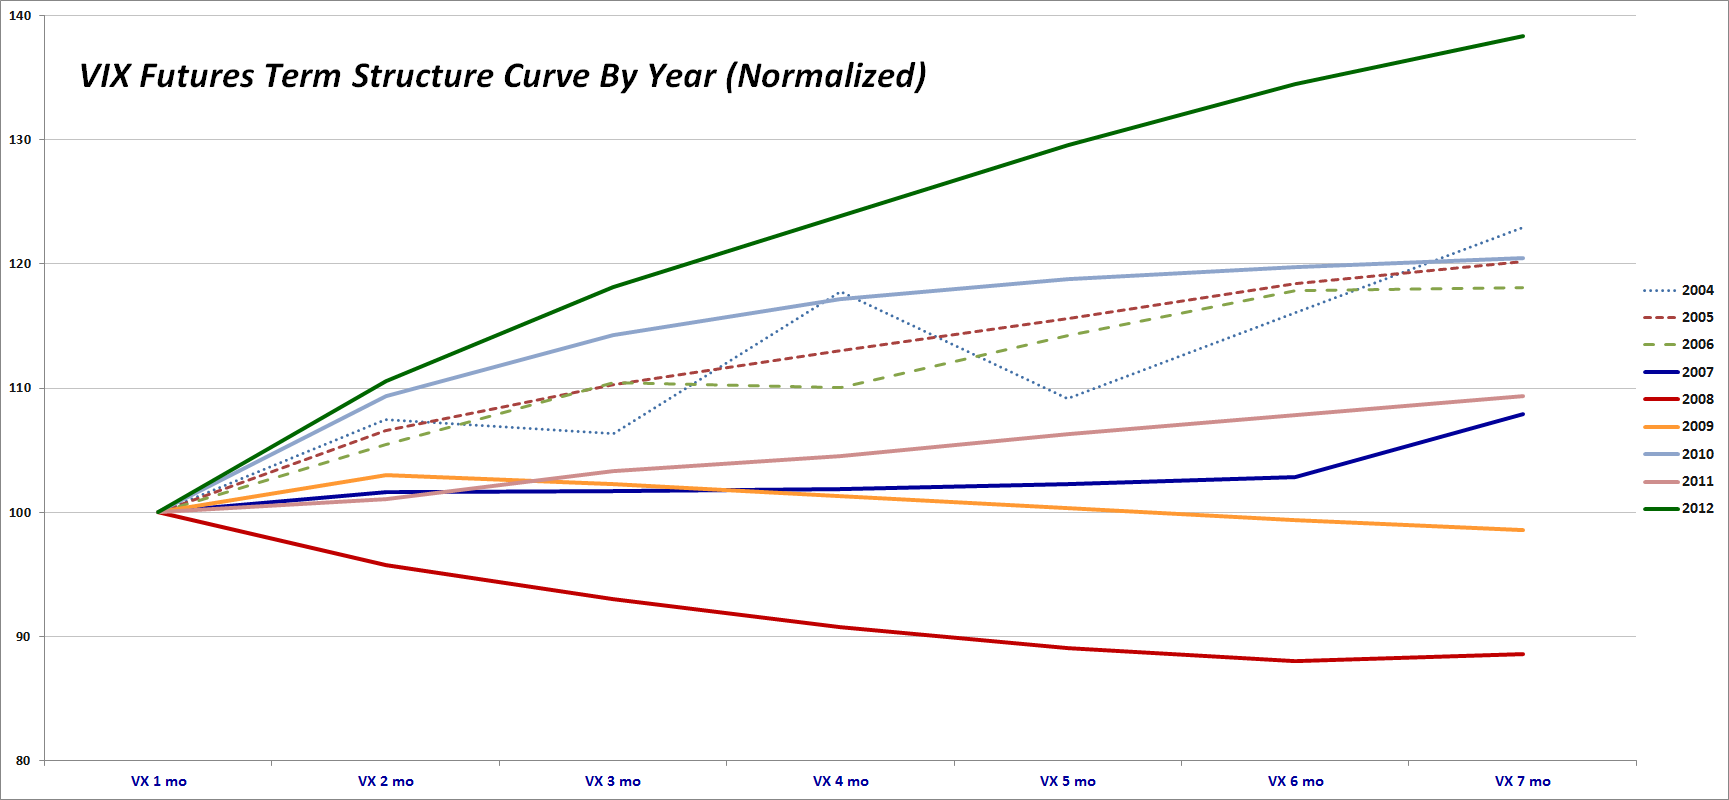
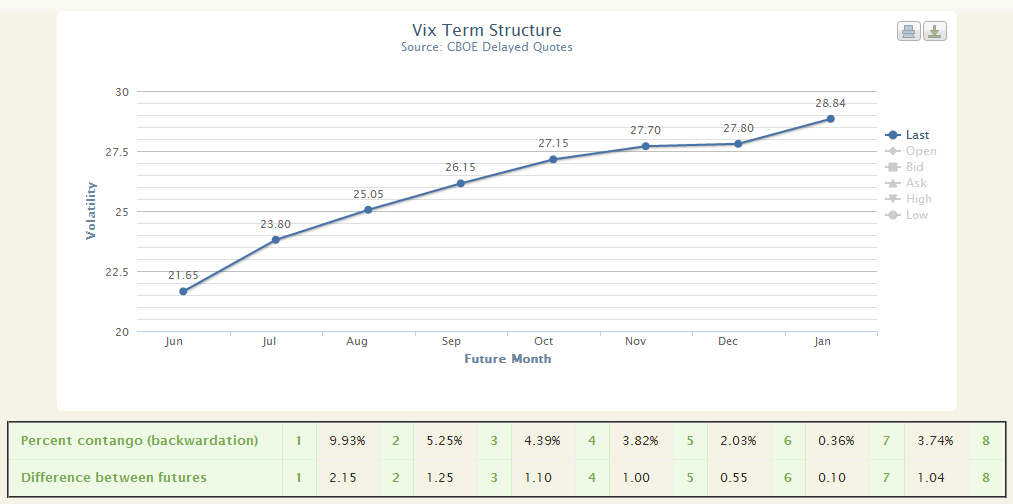
both products to the vagaries of contango and backwardation.  In the event these are terms you are not familiar with, I strongly recommend that you click on the links above and educate yourself.  Believe it or not, this is the ninth year I have been talking about the VIX futures term structure, negative roll yield, contango and backwardation.  (Those who have been paying attention since the early days of VXX and VXZ have no doubt profited mightily from this knowledge.)

The beauty of EVIX and EXIV is that these products create so much flexibility for investors 
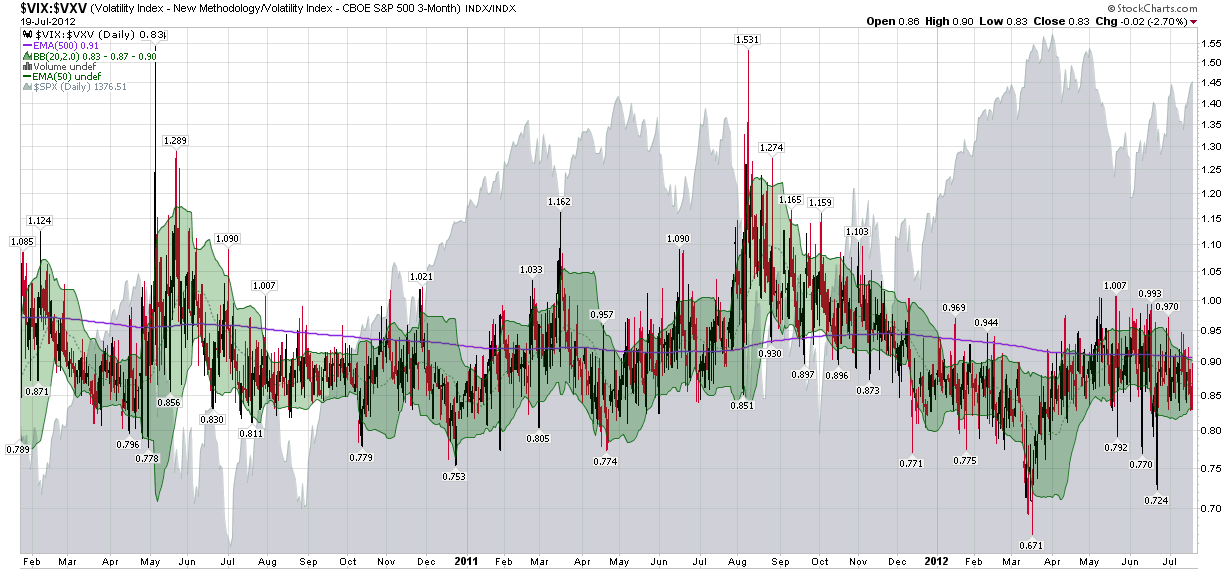
who maintain a global, cross-asset class view of volatility.  In the run-up to the first round of the French election, for example, VSTOXX spiked dramatically and pushed the VSTOXX:VIX ratio below 1.00, creating some interesting arbitrage opportunities and/or pairs trades in the process.  Now investors can trade euro zone volatility against U.S. volatility, use targeted hedges for risk that is specific to the euro zone or speculate more easily about the direction of volatility in the euro zone.

I encourage everyone to study the EVIX and EXIV prospectus closely.

This is a huge development in the volatility space and if options on EVIX and EXIV follow later this week, as expected, the volatility trading landscape will be much richer and more diverse. 

Now if we can only get liquid volatility products for gold volatility (GVZ) and crude oil volatility (OVX), I won’t even have to set out a stocking next to the chimney this Christmas.

While I’m at it, why are there no options on XIV?  This is such a popular high-beta product that it deserves options so traders can express a broader range of opinions on volatility.  Readers, it never hurts to nudge the CBOE on these issues.  An outpouring of popular sentiment can make a difference.

As the risk of charging off into full rant mode, I feel compelled to say that I hope volatility investors know a good thing when they see it.  It is a shame that VXST futures did not attract enough attention to hang around and that VMAX and VMIN are not 
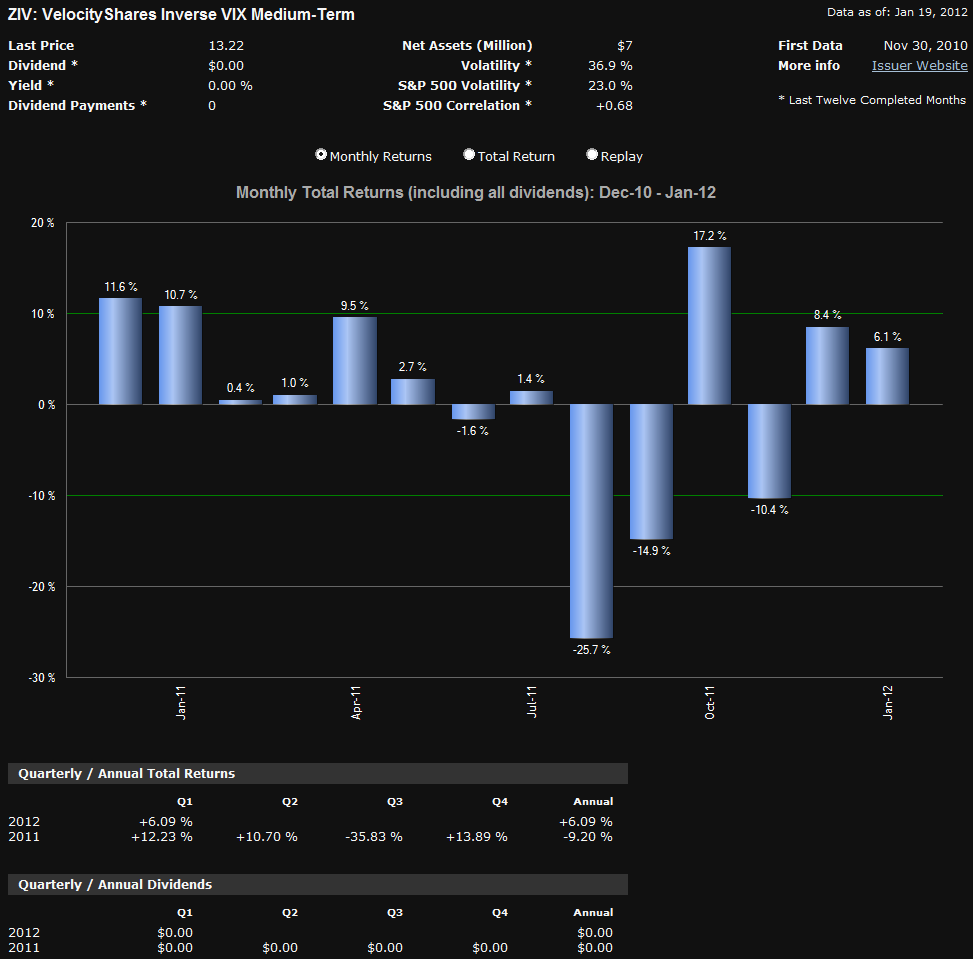
trading with higher volumes.  One of the best volatility products ever created, ZIV, nearly died of neglect before investors finally paid it some attention.

As I see it, EVIX and EXIV as well as VMAX and VMIN are test cases for the future of the breadth of volatility products.  If you would like a diverse tapestry of volatility products in the future, it would not hurt to “buy local” volatility ETPs rather than sticking to the handful of already successful products.  If you don’t vote with your feet, you had better be happy playing in a small and rather limited sandbox.  I am fond of saying, “In volatility, there is opportunity!” – but that opportunity is a function of the richness of the various volatility product platforms.

Last but not least, I know Eurozone and eurozone are the preferred spellings, but I am sticking to the two-word “euro zone” with as much stubbornness as I can muster.  What can I say, I am short convention…

Further Reading:

For those who may be interested, you can always follow me on Twitter at @VIXandMore

Disclosure(s): net short VXX and VMAX; net long XIV and ZIV at time of writing.  The CBOE is an advertiser on VIX and More.

Monday, January 2, 2017

The 2016 VIX Futures Term Structure: Extraordinarily Average

Two days ago, in The Year in VIX and Volatility (2016), I made no mention whatsoever of the VIX futures term structure.  Traders of the full range of VIX products (futures, options and ETPs) hopefully know by now that the entire VIX product landscape is based -- and priced -- off of VIX futures and one of the most important aspects of VIX futures is the shape of the term structure.

Long story short:  as the graphic below shows, the 2016 VIX futures term structure (double red line) was closer to its historical average (wide gray line) than any prior year since the launch of VIX futures in 2004, with the average term structure over the course of the year demonstrating a relatively modest upward sloping term structure, also known as contango.


[source(s) CBOE, VIX and More]

By way of explanation, the graphic above shows the average (mean) normalized term structure for each year since the VIX futures were launched. In normalizing the data, I have set the average front month VIX futures contract to 100 and have expressed the averages of the second through seven months as multiples of the front month.  Note that the terms structure lines are dotted and somewhat wavy for 2004 – 2006, due to the fact that the CBOE did not implement a full complement of consecutive monthly futures until October 2006.

In terms of takeaways, since I have not posted this graphic in two years, note that the term structure for 2015 was slightly flatter than average.  Looking back a couple more years, note that 2012 and 2013 saw the steepest term structure on record.  In the thirteen-year history of VIX futures, only two years saw a downward sloping term structure, also known as backwardation2008 and (barely, depending upon how one measures) 2009.

During the course of 2016, the VIX futures term structure moved into backwardation on four separate occasion and closed in backwardation on a total of 37 days – with 31 of those 37 days running consecutively from January 4th to February 16th.  These four instances and 37 days are just slightly below the average year, as can be seen in the graphic below.


[source(s) CBOE, VIX and More]

Last but not least, the average term structure for the year as well as the frequency and magnitude of the contango-backwardation dance is a strong determinant of the annual performance of the VIX ETPs and in my next post I will detail why 2016 was unlike the previous year, where Every Single VIX ETP (Long and Short) Lost Money in 2015.

Related posts:


For those who may be interested, you can always follow me on Twitter at @VIXandMore


Disclosure(s): the CBOE is an advertiser on VIX and More

Tuesday, May 17, 2016

Updated VIX ETP Landscape, Including VMAX and VMIN

Now that the recently launched REX VolMAXX Long VIX Weekly Futures Strategy ETF (VMAX) and REX VolMAXX Inverse VIX Weekly Futures Strategy ETF (VMIN) VIX exchange-traded products have started to achieve critical mass, I thought it would be a good time to update my VIX ETP landscape chart.

In the graphic below, I have plotted all of the VIX ETPs with respect to their target maturity (X-axis) and leverage (Y-axis). 


[source(s):  VIX and More]

The most interesting change in this chart is the addition of VMAX and VMIN, which are on track to trade over 100,000 as a pair today for the first time since their launch two weeks ago.  In deciding where to plot these two issues, I note that the 10-day historical volatility of VMAX and VMIN is approximately 30% higher than their more popular competitors, VXX and XIV.  As VMAX and VMIN are actively managed and do not have a fixed target maturity, I am electing to assume that based on the early history, the target maturity is in the 2-3 week range.  Additionally, while there is no leverage being used in the traditional sense, as is the case with UVXY, TVIX and TVIZ, so far the use of VIX weekly futures in addition to the standard monthly VIX futures means that VMAX and VMIN have a higher beta than VXX and XIV.  For this reason, I have also plotted VMAX and VMIN as having slightly higher "leverage" than the group of VIX ETPs that have a target maturity of thirty days, such as VXX, XIV, etc.

Frankly, I am a little surprised that VMAX and VMIN have not attracted more interest in the trading community, as these products have features that should be very attractive to short-term traders.  For now, the bid ask-spreads are typically in the 0.05 – 0.10 range, but as these tighten up, I expect volume and trading interest will ramp up quickly.

One necrology housekeeping note of interest:  Citibank has decided to redeem early its C-Tracks Exchange-Traded Notes Based on the Citi Volatility Index Total Return (CVOL).  The last day of trading for CVOL will be May 23, 2016, with cash payments to be made to investors on May 24, 2016.  The diagonal “X” through the ticker symbol in the chart indicates that this is the last time CVOL will appear on this graphic.

Finally, when one is trading VIX ETPs, it is always essential to consider the degree of contango (or backwardation) in the VIX futures, which can translate into substantial negative roll yield.  For the record, the current month is on track to have the third largest average negative roll yield for the month in the thirteen-year history of the VIX futures.  For those who may be interested, the top two months in terms of extreme negative roll yield were March 2012 and July 2004.

Related posts:


Disclosure(s): net short VXX, VMAX, UVXY, TVIX and TVIZ; net long XIV, VMIN and ZIV at time of writing

[source(s):  VIX and More]

Sunday, December 30, 2012

Portfolio Insurance for (Almost) Free

A lot of strange things happened in the financial markets late on Friday afternoon and a good deal of the craziness was in the VIX futures market, with impacts felt in the likes of VXX, which jumped 11.6% in less than an hour (the last 40 minutes of the regular session and the first 14 minutes of after-hours trading.)

The corresponding spike in the VIX futures prices pushed the front two months of the VIX futures term structure into backwardation (a downward sloping term structure curve in which front month futures contract is priced higher than the second month futures contract) for only the second day since November 2011, with the lone exception dating from May 18, 2012, when the front two month contracts were in backwardation by a mere 0.05 points.

The chart below shows how the VIX futures term structure changed over a ten-day period from December 18 to December 28. While all eight VIX futures contracts that were trading on both dates showed in increase, the magnitude of these increases were skewed dramatically toward the front months, where the January VIX futures contract jumped 38.4%, the February contract gained 28.4%, the March contract rose 21.2%, etc. Also of note, whereas the December 18th term structure was upward sloping in an almost perfect linear fashion, by December 28th the term structure had twisted so that the January contract is now trading at a higher level than the contracts for the February, March, April and May expirations. In fact, the market is now pricing in expectations that a VIX of about 22 will persist for the next five months.

[source(s): CBOE Futures Exchange (CFE)]

With the backwardation in the front two months of the VIX futures contracts, this also means that investors who are looking to hedge long equity exposure against an increase in volatility can now take advantage of what is essentially free portfolio insurance. Of course I am using the “free” label loosely, but given that the short-term VIX futures (first and second month contracts) are in contango (front months less expensive than more distant months) more than 80% of the time and subject to the price decay associated with negative roll yield while in contango, I feel it is important to underscore that the short-term VIX futures roll yield is now positive, meaning that if the VIX January and February contracts do not change in price, the positive roll yield should provide a small lift to VXX, UVXY, TVIX and the other short-term VIX ETPs with a long volatility bias.

Now before anyone gets too excited about the possibility of free portfolio insurance, it is important to understand that the reason the VIX futures are in backwardation is that market participants anticipate that the VIX will decline going forward, making a long volatility hedge of limited value. So while long positions in VXX, UVXY, TVIX and their ilk are benefiting from positive roll yield at the moment, most investors consider that a decline in the VIX and VIX futures is likely to more than compensate for any gains due to roll yield, meaning that these hedges will probably be net losers when one accounts for the changes in the VIX futures and the roll yield.

[Since some of the subjects above have not come up for discussion in a fairly long time, today’s set of links is more comprehensive than usual. As always, these are not arranged in order of significance, but are grouped roughly by subject matter, with some of the more recent posts on the subject toward the top.]

Related posts:

Disclosure(s): short VXX and UVXY at time of writing

Sunday, October 21, 2012

The 2012 VIX Futures Term Structure as an Outlier

Investors who have been trading the VIX futures, VIX options and VIX exchange-traded products in 2012 have no doubt observed that there has been a wide gulf between the volatility predicted by the VIX front month futures and the back month futures. How wide? Well the graphic below shows the average (mean) normalized term structure for each year since the VIX futures were launched, back in 2004. In normalizing the data, I have set the average front month VIX futures contract to 100 and have expressed the averages of the second through seven months as multiples of the front month.

[Note that while the VIX futures were launched in 2004, consecutive VIX futures contracts for the first six months were not available until October 2006, hence the dotted lines for these years to reflect the erratic nature of the data. Also, I have included the seventh month contract in the calculations because this month is critical to the calculations of a number of VIX ETPs, including VXZ, VIXM, ZIV, etc.]

[source(s): CBOE]

For anyone who has followed the VIX futures closely, it should come as no surprise that 2008 (solid red line) is the only year in which the full VIX futures term structure was in backwardation (front months higher than back months) in aggregate. During 2009 (solid orange line), the term structure transitioned from backwardation to contango (front months higher than back months) and for the most of the balance of its life, the VIX futures term structure has remained in contango.

The graphic shows no discernible trend of extreme contango evolving over the past few years. While 2010 is the year with the second highest degree of contango across the full term structure, contango was decidedly muted during 2011. In fact, 2011 saw the longest continuous stretch of backwardation during the height of the European sovereign debt crisis.

Looking closely at the differences between 2012 and 2010, there is very little difference in contango out to the second month. The normalized term structure curves begin to diverge substantially only after the third month, where the 2010 term structure begins to flatten and the 2012 term structure continues an almost linear ascent. In fact the most distinctive feature of the 2012 term structure is the absence of any significant flattening in the VIX futures curve in months four, five, six and seven. This is part of the reason that while XIV is up 165% for the year, ZIV has managed a gain of 72%.

As this series continues, I will examine some of the possible causes of the recent persistent steep contango in the VIX futures term structure, particularly in some of the back months.

Posts in current series on VIX futures:

Related posts:

Disclosure(s): long XIV and ZIV at time of writing

Thursday, July 19, 2012

Crazy VIX:VXV Ratio Chart

There was a point in the history of VIX and More that I gave serious consideration to a regular feature in which I unveiled “Strange and Unusual Charts” that presumably had, apart from their novelty, the ability to shine some new light on at least one corner of the investment universe. That being said, I have always had an affinity for presenting charts that show unusual ratios, non-standard time frames and such and while the likes of Chart Porn and Unusual Chart of the Month: VXO and RVX did get me started down a slippery slope, I never quite fell into the habit of tilting wildly at windmills on the plains of StockCharts.com and their brethren.

One rabbit hole that I was definitely the first down and pursued the most aggressively was the VIX:VXV ratio, which one blogger insisted was sure to ultimately be my investing legacy. In all fairness, for the first year following the launch of VXV (essentially a 93-day version of the VIX), the VIX:VXV ratio performed as if it was going to make all other indicators obsolete. Of course, then the financial crisis of 2008 hit and the ratio began sprouting warts all over. While I talk about the VIX:VXV ratio only rarely in this space nowadays, the general idea of which the VIX:VXV ratio is just one instance of what has become one of the main themes of this blog: the idea that an understanding of the VIX futures term structure is critical to understanding the valuation of and trading opportunities available for all VIX products, including futures, options and exchange-traded products.

All of which brings me – somewhat belatedly, perhaps – to today’s chart, which is right out of the same cauldron that produced some of the curiosities of yesteryear. The chart below captures 2 ½ years of daily bars in the VIX:VXV ratio and adds some green Bollinger bands for color and context, along with a gray area graph of the SPX. Finally, I have included a purple line for the VIX:VXV ratio that reflects a 500-day exponential moving average (EMA) in order to show the long-term average of the ratio.

While there are many interesting nuggets buried in this chart, first note that the long-term average of the VIX:VXV ratio is not 1.00, but generally hovers in the 0.90 – 0.95. This reflects the fact that the VIX futures term structure has historically been in contango (upward sloping, with nearer months less expensive than more distant months) 75-80% of the time. Second, note that spikes in the ratio tend to coincide with bottoms in stocks and vice versa. Finally, note that even with the crazy VIX spike last August and September (and record backwardation, i.e. high VIX:VXV ratios), the ratio has been depressed since December and the 500-day EMA is now making all-time lows.

What does this mean? Lots of things, but in simple terms investors continue to believe that the VIX is unnaturally low given the scope and magnitude of the future threats to equities. Should the ratio continue at its current 0.83, I would be very concerned about the possibility of a bearish reversal.

[In order to keep this post to a manageable length, I have skipped over a bunch of related issues, but readers should feel free to wander down some of the same rabbit holes I have preserved in the links below.]

Related posts:

[source(s): StockCharts.com]

Disclosure(s): long VIX at time of writing

Saturday, June 9, 2012

New and Noteworthy: VIXcentral.com

As a blog where the central focus is on the VIX and related subjects, I always try to keep an ear to the ground for new sources of information, analysis, data, tools, etc. for the VIX and volatility.

When a particularly interesting new site catches my attention, I try to highlight it in this space. Launched just a couple of weeks ago, VIXcentral.com is once such site. Eli, who runs VIX Central, is an active trader in the VIX products space. After writing a program that uses real-time VIX futures quotes from his broker to create a real-time VIX term structure graph, he asked himself, “Why not make the VIX term structure information available in graphic form over the web? Perhaps others would find this information useful also.” The result is VIX Central.

The centerpiece of VIX Central is the main page is a VIX futures term structure graph (see below), which also tabulates the absolute price difference between each of the VIX futures adjacent months, as well as the percentage contango or backwardation between these months.

Another tab worth investigating is the Historical Prices tab. Here you can call up the VIX futures terms structure for any date going back to March 2007. This can be done for individual dates or for as many as twenty dates on one chart. To see multiple days superimposed on the same chart, click on the Multiple Dates per Graph button and start with a date like September 30, 2008, then keep clicking on the Next Date button to see how the term structure evolves.

I am not sure where the site is going from here in terms of new features, but Eli indicates he is currently evaluating some similarity algorithms that can indicate which term structure periods in the past are similar to the current one.

The bottom line: VIX Central is informative and a valuable piece of information for anyone who trades the VIX product space. The historical term structure data is both fun and educational. Keep an eye on this site and if you have any feature requests regarding similarity algorithms or other functionality, this would probably be a good time to click on the Questions, Feedback and Suggestions link.

Enjoy!

Related posts:

[source(s): VIXcentral.com]

Disclosure(s): Livevol is an advertiser on VIX and More

Wednesday, February 1, 2012

Natural Gas, Contango and UNG

I have talked at length in this space about the contango and negative roll yield issues that plague VXX. Periodically these discussions trigger a question from a reader about the impact of contango on some of the other ETPs.

Just to be clear, as far as ETPs are concerned, contango and backwardation issues are limited solely to those products which hold futures in their portfolio. The large majority of futures-based ETPs are in the commodity space, but in theory at least, any security for which there are futures could end up with a futures-based ETP. Fortunately, ETFdb keeps a handy list of these products at their Futures-Based ETF page.

The main reason why I talk so much about contango in the context of VIX-based ETPs is that the VIX products have a tendency to produce huge levels of negative roll yield (at a rate of 11% per month at the moment in the front two months of the VIX futures) relative to the other products.

Outside of the VIX product space, contango is probably most notorious in crude oil and natural gas – and the two most popular ETPs for these commodities, USO and UNG. Still, contango in these products is generally much smaller than it is with VXX, but right now contango is unusually high in UNG. While contango (front two months) in USO is only 0.4% right now, it is actually at 7.6% per month in UNG.

Note that unlike VXX, which has a daily roll, UNG rolls its entire portfolio over the course of four days per month. Better yet, UNG publishes a schedule of their roll dates, reprinted below, though it does come with the disclaimer, “Roll Dates are projected and subject to change without notice.”

So…while it has already been a great year for those who are short natural gas, it is possible that persistent contango will make short UNG positions even more profitable going forward.

Finally and perhaps most important of all, it is critical to keep in mind that steep contango does not happen willy nilly. Instead, contango is essentially a reflection of where the market expects prices to be headed (net of the cost of carry) in the future. Looked at in this context, UNG contango of 7.6% means that the reason shorts are receiving a 7.6% benefit from the negative roll yield is that the market anticipates prices will rebound 7-8% or so over the course of the next month. Contango and roll yield are not a free lunch by a long shot, but over the long term, if risk can be properly managed, positions that benefit from contango should be able to finance at least a few lunches.

Related posts:

[source(s): United States Natural Gas Fund]

Disclosure(s): short VXX and UNG at time of writing

Friday, January 20, 2012

ZIV Undeservedly Neglected

Much to my amazement, next week will mark the third anniversary of the launch of the first two VIX ETPs: the S&P 500 VIX Short-Term Futures ETN (VXX) and the S&P 500 VIX Mid-Term Futures ETN (VXZ).

Some may recall that investors were slow to warm up to these ETNs (see Charting the Assets of Volatility-Based ETPs), but these two products are now #1 and #5 in the very successful volatility ETP space, with assets of $700 million and $188 million, respectively.

It is no secret that VXX has always been the darling of short-term traders, while VXZ has struggled at times to find a broad audience. As investors have become better educated about the influence of the VIX futures term structure and resulting roll yield on returns, interest in VXZ relative to VXX has picked up, but the latter, with its target maturity of five months, continues to play second fiddle to its short-term (one month target maturity) sibling.

I was curious see how this dynamic played out when VelocityShares rolled out two products that are essentially the inverse of VXX and VXZ in November 2010. Once again the short-term product captured the bulk of the interest of traders, as XIV quickly established itself as the #2 product in the VIX ETP space. While the love for XIV is certainly understandable, due to the history of persistent contango and negative roll yield in VIX futures, this product suffered a huge drawdown as the European sovereign debt crisis and resulting record backwardation wiped out 75% of the ETPs value from July through November 2011.

Against this backdrop, I am frankly surprised by the lack of interest investors have shown in ZIV, the VelocityShares Daily Inverse VIX Medium-Term ETN. In a nutshell, ZIV has many of the same benefits of long XIV and/or short VXX positions, with much less risk. Specifically, ZIV benefits from negative roll yield about 65% of the time, with VIX futures data going back to 2004 indicating that the annual benefit due to negative roll averages out at more than 20% per year. With XIV getting all the attention, I wonder if investors are aware that XIV is down and ZIV is up since the two products were launched.

Of course, like XIV, ZIV is exposed to sharp spikes in the VIX, as the chart below reflects. It is worth noting, however, that when the VIX spikes, ZIV can be expected to lose value at about half the rate of losses in XIV. For example, while XIV was falling 75%, ZIV was down 42%.  It bears repeating that one of the key features of inverse volatility products is that the potential for large short-term losses is significant, even though the long-term prospects are promising.

Finally, for those who are investing in or trading VIX-based ETPs, it is important to keep in mind that short-term returns are most likely to be a function of changes in the VIX and VIX futures, while long-run returns will be dominated by the VIX futures term structure.

Related posts:

[source(s): ETFreplay.com]

Disclosure(s): long XIV and ZIV, short VXX at time of writing

Monday, January 2, 2012

The Year in VIX and Volatility (2011)

One of the most-loved charts I assemble each year is my retrospective look at the year in volatility. I already touched on some of the highlights of event volatility in text form in Expectations, Surprises and Fear in 2011, but this is one case in which I believe a picture does a better job of telling the story in the context of a timeline for the entire year.

From a volatility perspective, the first half of 2011 was relatively benign, even though the global social and economic fabric was ripped by Arab Spring and the Japanese trio of disasters which came in the form of the earthquake, tsunami and nuclear meltdown.

Things were much more promising during the middle of the year when the Greek parliament voted in favor of austerity and the euro zone agreed to expand the European Financial Stability Facility (EFSF) to €780 million.

For a while, there was considerable angst surrounding the bipartisan politics associated with the U.S. debt ceiling deadline at the beginning of August, but only after the Democrats and Republicans failed to come up with a meaningful debt reduction deal did investor anxiety shift back to Europe. Ironically, the downgrade of the U.S. debt from AAA to AA+ had very little impact on Treasury securities, which actually began to rally sharply after the downgrade. When Europe returned to the center stage, however, the sovereign debt crisis was escalating rapidly and it was now Italy that was in the crosshairs. The VIX shot up to 48 on August 8th and was regularly above 30 through the end of November, setting a new record for persistent backwardation in the VIX futures in the process.

The VIX was a high wire act throughout August and September, with multiple excursions into the 40s. Even after the S&P 500 index bottomed on October 4 at 1074, the VIX remained stubbornly elevated in October and November, before finally falling into the 20s in December. While the SPX was essentially unchanged for the year, the VIX ended 2011 at 23.40, up 31.8% over 2010’s close of 17.75. At the same time, the VIX futures are calling for a VIX of between 29 and 30 by the mid-point of 2012, suggesting that volatility will climb higher once again in the coming months.

In a year where most asset classes struggled mightily, volatility was one of the few great long positions. With a higher starting point going into 2012, it will be difficult for the VIX to repeat its market-beating performance once again, but if the euro zone and some of the geopolitical flash points fail to make progress, 2012 may indeed be the year of the VIX.

Finally, since I had so many requests for a high-resolution version to download last year, I am going to preemptively offer a full resolution PNG screen capture of the graphic below for download here.

Related posts:


[source(s): StockCharts.com]


Disclosure(s): none

Friday, November 4, 2011

VIX Futures: A Tale of Two Backwardations

After yesterday’s New VIX Backwardation Record post, I thought it might be interesting to compare the VIX futures term structure during the past three months to that of the prior record, which spanned September to December 2008.

The mechanics for graphing VIX futures over time are fairly complicated, as not only do values change daily, but on any day there can be up to ten futures contracts traded, with the front seven months generally being the only actively traded contracts. Of course, the futures roll every month, so the result is a rolling and scrolling array of data.  My efforts at oversimplifying this problem for the purposes of comparing the record 2011 backwardation data and the prior record data from 2008 resulted in the graphic below, which shows the average front month, second month, etc. values for the VIX futures all the way out to the seventh month.  Note the relatively mild in backwardation in 2011 compared to the steep backwardation in 2008. In fact, the 2011 curve is essentially flat from the third month through the seventh month, while the 2008 curve slopes down throughout the entire term structure.

Clearly some of the differences between the shape of the term structure in 2011 vs. 2008 can be attributed to the absolute level of the VIX and the fact that mean reversion expectations were therefore much higher in 2008 than during the past few months.

Students of the VIX may find it interesting that the front two months of the VIX futures briefly reverted to contango in the middle of December of 2008, while both the VIX and the front month VIX futures were still above the 55.00 level.

As it turns out, the VIX futures during late 2008 greatly overestimated the level of the VIX during the first half of 2009. It will be interesting to see if the same can be said for the first half of 2012.

Related posts:

[sources: CBOE Futures Exchange, Interactive Brokers]

Disclosure(s): short VIX at time of writing

Thursday, November 3, 2011

New VIX Backwardation Record

This week marks the first time that the front two months of the VIX futures term structure have been in backwardation each day for more than three consecutive months. In fact, the current streak of 68 days eclipses the old record of 63 days that dates to the 2008 financial crisis.

While the backwardation streak is intact for the front two months, when looking at the full VIX futures term structure, the futures curve has reverted to contango five times over the course of the past three weeks. The primary reason that the front two months have remained in backwardation in defiance of the rest of the VIX futures term structure has to do with something I call the “holiday effect” or “calendar reversion.” Essentially, what happened a little over two weeks ago was that the roll from the October front month to the November front month VIX futures, as well as from the November second month to the December second month VIX futures has added some incremental holiday effect backwardation to the front two months. This is due to the fact that the second month VIX futures have an expiration of December 21st, and these are artificially depressed due to the historically low volatility associated with the holiday season. The impact is being felt by all the short-term VIX futures ETPs that are buying second month (December) VIX futures at artificially depressed levels and selling front month (November) VIX futures as part of the daily rebalancing process.

The graphic below shows the 1.70 point differential between the front month and second month VIX futures. Note that it is not until February 2012 that the term structure starts to flatten out, as investors begin to converge on the idea that the VIX is likely to hug the 30 level for the better part of the first half of next year.

Related posts:

[source: Interactive Brokers]

Disclosure(s): short VIX at time of writing

Friday, September 16, 2011

Front Two Months of VIX Futures Slip Back Into Contango

For the first time since the end of July the front two months of the VIX futures are in contango, after spending 1 1/2 months in backwardation.

While the degree of contango is very slight at the moment, this means that the short-term inverse VIX futures ETPs (e.g., XIV) are now benefiting from negative roll yield, while the short-term long VIX futures ETPs (VXX, TVIX, etc.) are no longer receiving the benefit of positive roll yield from backwardation and now face a slight headwind.

Wednesday, August 10, 2011

VIX Backwardation Commentary

My recent VIX Term Structure Evolution Over Last Ten Days post seemed to draw a fair amount of interest from the Financial Times, Forbes and elsewhere, with some pundits claiming that the move from contango to backwardation in the VIX futures was foreshadowing everything from a “full-fledged bear market” to a “systemically important shock event.”

Just five days later, the VIX seems to have peaked, yet the amount of backwardation in the VIX futures term structure has actually increased. Looking at the front two months of VIX futures (which is where investors in the likes of VXX and XIV should be focusing), I note that the front month (August) is now 7.25 points higher than the second month (September) VIX futures. This positive roll yield means that investors who are short VXX and/or long XIV are losing almost 1% per day due to daily rebalancing (rolling) that involves selling the front month VIX futures and buying the second month contract.

This also means that should the VIX spike higher from current levels, ETNs such as VXX of TVIX and others should see enhanced returns due to an increase in volatility plus favorable term structure and roll yield.

One problem with backwardation is that it tends to be fleeting. Of the 59 instances of backwardation in the front and second month portion of the VIX futures term structure going back to the inception of VIX futures in 2004, 37% lasted only one day and 56% lasted no more than two days, fully 83% of all instances of backwardation had ended within six days and only six backwardation events in seven years have lasted more than the current eight days. Not surprisingly, three of those six periods of extended backwardation were from 2008, two were from 2009 and the last one was from 2007.

To state what I hope is the obvious, detailed knowledge of the workings of the VIX futures term structure is mandatory for anyone who trades VIX ETPs. Not only does one need to know what the implications are of the current term structure, but also to have a sense of how that term structure is likely to evolve over time.

Related posts:


Disclosure(s): long XIV; short VIX, VXX and TVIX at time of writing

Friday, August 5, 2011

VIX Term Structure Evolution Over Last Ten Days

If you think the last two weeks have turned the investing world upside down, well you have to look no farther than the VIX futures term structure to see just how accurate that view is. Two weeks ago the VIX was in the 17s and the VIX futures term structure was in contango (upward sloping) and today the VIX closed at 32 and the VIX futures term structure is in backwardation. In fact, the current VIX term structure looks a lot like a mirror image of what it was two weeks ago.

In the graphic below, I have detailed the shift in the term structure from July 22nd to today’s close. During that period, the S&P 500 index has sold off 10.8%, while the VIX has spiked 82.6%. Note that the front month (August) VIX futures have advanced sharply – up 59% during this period – but not as sharply as the VIX. Looking at the back end of the term structure, the March 2012 futures were not traded back on July 22nd, so the February futures are the most distant futures for which we can compare prices. Their move lagged the VIX and front month futures by a large margin and was almost identical in magnitude to that of the SPX, up 10.7% in those two weeks. One can clearly see from the funnel formed by the two term structure lines that for each month farther out in the term structure, the VIX futures were less responsive to the move in the SPX or the VIX.

In addition to annotating the backwardation and contango in the graphic, I have also circled the December VIX futures and options expiration (December 21st) in an effort to preempt some questions about why these futures seem unusually low both now and two weeks ago. The simple answer is the preponderance of holidays toward the end of the year, with fewer trading days translating into fewer opportunities for extended moves in volatility. I have discussed this phenomenon many times in the past (see VIX and the Week Before Christmas, for starters) and have named it the “holiday effect” or “calendar reversion.” Also note that December has a history of being relatively bullish for stocks, with low volatility.

Finally, I have fielded quite a few questions about the implications of yesterday’s 35.4% VIX spike. Here some prior research on the Short-Term and Long-Term Implications of the 30% VIX Spike will undoubtedly be of interest to most readers. The quick takeaway is that this event is bullish for stocks and bearish for volatility. I would expect to see more evidence of this fact beginning to kick in on Monday.

Related posts:


[source: Interactive Brokers]

Disclosure(s):
short VIX at time of writing

Sunday, January 30, 2011

Chart of the Week: VXX Celebrates 2nd Birthday

One year ago today, in Chart of the Week: VXX Celebrates One Year of Futility, I chronicled the first year of the iPath S&P 500 VIX Short-Term Futures ETN, known to most by its ticker symbol, VXX. At the time, I noted that VXX had fallen 68.4% in its first year and made the prediction, “I expect VXX to perform better relative to the VIX in its second year than it did in its first year, though admittedly this is not a very high bar to clear.”

Well, low bar or not, the performance of VXX was even worse in its second year than in its first year. In spite of the fact that VXX rallied 8.4% on Friday to close out the second year on a high note, its performance in the second year slipped to -74.6%, giving the ETN the dubious distinction of having fallen 92% since its launch two years ago.

While I have been chronicling the shortcomings of VXX for the better part of these past two years, let me go on record as saying that VXX does exactly what it sets out to do: capture a portfolio of VIX futures with a constant maturity of 30 days, with daily rolling used in order to achieve the constant maturity. As detailed in the links below and in many other places in this blog, it is the daily rolling in the face of persistent contango which triggers negative roll yield and acts as a drag on the price of VXX. In fact, VIX futures contango has been extremely elevated since the end of August, which largely explains why VXX lost 74.6% in the past year when the VIX declined only 18.6%. To compare the contango impact of the second year of VXX with the first year, all one needs to know is that in the first year VIX outperformed VXX by 26.2%, while in the year just concluded, VIX outperformed VXX by a whopping 56.0%.

This does not mean that investors should shun VIX as a volatility trade. In the short-term, VXX is a viable long volatility play, as evidenced by Friday’s 8.4% gain. When the VIX futures curve slides from contango to backwardation, VXX can also be an attractive trade. The problems on the long side begin when investors utilize holding periods of more than a couple of days. In the long run, volatility is mean-reverting and offers no natural directional advantage. For this reason, the longer the holding period, the more VXX trades become term structure rather than directional trades, with the term structure favoring contango over backwardation approximately 75% of the time.

With this in mind, I will repeat the same prediction I made one year ago, undaunted: VXX will perform better relative to the VIX in the coming year than it has in the past year.

Related posts:


[source: StockCharts.com]

Disclosure(s): short VXX and VIX at time of writing

Thursday, January 27, 2011

The Skinny on XVIX

Of all the second generation volatility-based exchange-traded products that have been launched in the past few months, the one I find most intriguing is the UBS E-TRACS Daily Long-Short VIX ETN, which I prefer to refer to by its ticker symbol XVIX.

XVIX combines a 100% long position in the S&P 500 VIX Mid-Term Futures Excess Return Index with a 50% short position in the S&P 500 VIX Short-Term Futures Excess Return Index. It is therefore the functional equivalent of a position consisting of two units long VXZ and one unit short VXX. This combined long-short position nets out with very little exposure to volatility in most market conditions. Instead, XVIX is almost entirely a VIX futures term structure/contango play that increases in value when the slope of the VIX futures term structure is upward and/or getting steeper. On the other hand, XVIX comes under the most pressure when the slope of the VIX futures term structure is flattening or becoming downward sloping (i.e., entering into backwardation.)

While I was on a hiatus, Volatility Futures & Options put XVIX under a microscope in De-constructing XVIX and explored the historical data and the appeal of the 2:1 long-short ratio vis-Ă -vis a number of alternative ratios.

As I see it, XVIX is almost a pure play on the VIX futures term structure. The historical data provided by UBS and analyzed in some detail by Volatility Futures & Options shows annual returns in the 10-25% range prior to 2010, with a maximum drawdown in the 10-15% range. Last year has to be considered an outlier, as the mean daily contango as calculated by my proprietary VIX Futures Contango Index was 79, a huge premium over the lifetime average reading of 50 for this index. Not only was contango extreme in 2010, but it was also increasing for the majority of the year.

The bottom line is that 2010’s performance (up 55%, with a 5% maximum drawdown) in XVIX is not likely to be repeated any time soon. Over the long term, I expect XVIX to revert to annual returns in the 10-25% range. In the short-term, however, there may be some more significant bumps in the road as the VIX futures term structure unwinds some of its extreme contango and returns to a more consistently flat term structure.

Related posts:


Disclosure(s): short VXX; long VXZ and XVIX at time of writing

Thursday, September 9, 2010

VIX Weekly Options Coming on September 28

The CBOE Futures Exchange (CFE) announced today that it will begin trading weekly options on VIX futures as of Tuesday, September 28. Please note that unlike standard monthly VIX options which expire on Wednesdays, the weekly VIX options will expire on Fridays, as is the case with other weekly options. Also, settlement for weekly options will feature physical settlement - one futures contract for each expiring options contract. [Thanks to Chris McKhann for highlighting this important clarification.]

With the addition of weeklys to the VIX options stable, the proliferation of tradable VIX products has the potential to overwhelm and confuse investors. For example, in just three weeks we will have VIX futures options and VXX options expiring on the same date. The former will trade off of the VIX futures; the latter is based on iPath S&P 500 VIX Short-Term Futures ETN (VXX), which is a weighted portfolio of front month and second month VIX futures.

Among other things, the new VIX weeklys set up some interesting volatility pairs trades, including a VXX-VIX options pair that has the potential to be able to isolate the contango and backwardation components of VXX using VIX options with an identical expiration date.

For volatility traders, 2010 is shaping up to be a banner year in terms of new products.

Related posts:

Disclosure(s): none

Thursday, July 22, 2010

XXV and the New VIX ETN Landscape

While I was out of pocket for a few days, Barclays had the temerity to launch a new VIX ETN. Not only that, but this new volatility product is the first inverse VIX ETN to hit the market. It goes by the formal name of Barclays ETN+ Inverse S&P 500 VIX Short-Term Futures ETN and has a ticker of XXV.

Others have already weighed in on XXV, including excellent coverage of the potential of this ETF from Adam Warner at the Daily Options Report, particularly in To Err is Blog-Human and XXV Finale. Another interesting post comes from Volatility Futures & Options and attempts to reconstruct the historical performance of XXV in XXV – Inverse VXX ETF First Day of Trading. Not to be outdone, Ron Rowland of Invest with an Edge asks some pointed questions of the branding approach at Barclays in XXV: Barclays Abandons iPath Brand with Inverse Volatility ETN.

Frankly, there are a lot more questions than answers for XXV at this stage. My initial impression, however, is a positive one. Both VXX and XXV are ideally suited for the day trading crowd and are useful for swing trades of several days or so. As far as longer holding periods are concerned, I am partial to XXV over VXX, as XXV should benefit from the same term structure rebalancing anomalies that have plagued VXX and have resulted in negative roll yield. In the case of XXV, the daily portfolio balancing should be a net plus over the course of long-term holding periods.

Several more VIX ETNs are in the works. In the graphic below, I attempt to outline the VIX futures (with the VX prefix) and ETN landscape, along with the two SPX implied volatility indices. Note that the volatility indices (VIX and VXV) both have a constant duration, as do the VIX ETNs: VXX; VXZ; and XXV. The duration of the VIX futures, however, decreases one day at a time (and jumps forward on weekends and holidays), which means that their time horizon continues to decline over the course of each VIX options (and futures) expiration cycle, which are represented by the large green arrows in the graphic. The bottom line is that when you have constant duration products, such as the VIX ETNs, which are priced off of declining duration products (VIX futures), then there will always be friction from the result of the portfolio rebalancing used to maintain a constant duration. The exact impact of the rebalancing depends upon whether the VIX futures are in contango or backwardation and the slope of the term structure. As a rule of thumb, the ETNs with the shortest duration (to the left in the chart below) will be impacted the most by contango and backwardation, while the ETNs with the longest duration (to the right) will be affected to a smaller degree by roll yield.

Finally, it is important to note that more VIX ETNs are on the way. The Jefferies S&P 500 VIX Short-Term Futures ETF (VIXX) targets a constant 30-day duration and has a great deal in common with VXX, while Bank of America’s Investable Volatility Index ETN (no ticker designated, to my knowledge) appears to be targeting VIX options (a first for this product category) with an average maturity of five months. CBOE has some skeleton information on their Investable Volatility Index (VOL), but I look forward to more digging up more details on the forthcoming ETN and sharing them when I do.

For more on related subjects, readers are encouraged to check out:


Disclosure(s): long XXV and short VXX at time of writing

DISCLAIMER: "VIX®" is a trademark of Chicago Board Options Exchange, Incorporated. Chicago Board Options Exchange, Incorporated is not affiliated with this website or this website's owner's or operators. CBOE assumes no responsibility for the accuracy or completeness or any other aspect of any content posted on this website by its operator or any third party. All content on this site is provided for informational and entertainment purposes only and is not intended as advice to buy or sell any securities. Stocks are difficult to trade; options are even harder. When it comes to VIX derivatives, don't fall into the trap of thinking that just because you can ride a horse, you can ride an alligator. Please do your own homework and accept full responsibility for any investment decisions you make. No content on this site can be used for commercial purposes without the prior written permission of the author. Copyright © 2007-2023 Bill Luby. All rights reserved.
 
Web Analytics