Showing posts with label 2009. Show all posts

Monday, January 2, 2017

The 2016 VIX Futures Term Structure: Extraordinarily Average

Two days ago, in The Year in VIX and Volatility (2016), I made no mention whatsoever of the VIX futures term structure.  Traders of the full range of VIX products (futures, options and ETPs) hopefully know by now that the entire VIX product landscape is based -- and priced -- off of VIX futures and one of the most important aspects of VIX futures is the shape of the term structure.

Long story short:  as the graphic below shows, the 2016 VIX futures term structure (double red line) was closer to its historical average (wide gray line) than any prior year since the launch of VIX futures in 2004, with the average term structure over the course of the year demonstrating a relatively modest upward sloping term structure, also known as contango.


[source(s) CBOE, VIX and More]

By way of explanation, the graphic above shows the average (mean) normalized term structure for each year since the VIX futures were launched. In normalizing the data, I have set the average front month VIX futures contract to 100 and have expressed the averages of the second through seven months as multiples of the front month.  Note that the terms structure lines are dotted and somewhat wavy for 2004 – 2006, due to the fact that the CBOE did not implement a full complement of consecutive monthly futures until October 2006.

In terms of takeaways, since I have not posted this graphic in two years, note that the term structure for 2015 was slightly flatter than average.  Looking back a couple more years, note that 2012 and 2013 saw the steepest term structure on record.  In the thirteen-year history of VIX futures, only two years saw a downward sloping term structure, also known as backwardation2008 and (barely, depending upon how one measures) 2009.

During the course of 2016, the VIX futures term structure moved into backwardation on four separate occasion and closed in backwardation on a total of 37 days – with 31 of those 37 days running consecutively from January 4th to February 16th.  These four instances and 37 days are just slightly below the average year, as can be seen in the graphic below.


[source(s) CBOE, VIX and More]

Last but not least, the average term structure for the year as well as the frequency and magnitude of the contango-backwardation dance is a strong determinant of the annual performance of the VIX ETPs and in my next post I will detail why 2016 was unlike the previous year, where Every Single VIX ETP (Long and Short) Lost Money in 2015.

Related posts:


For those who may be interested, you can always follow me on Twitter at @VIXandMore


Disclosure(s): the CBOE is an advertiser on VIX and More

Sunday, January 3, 2010

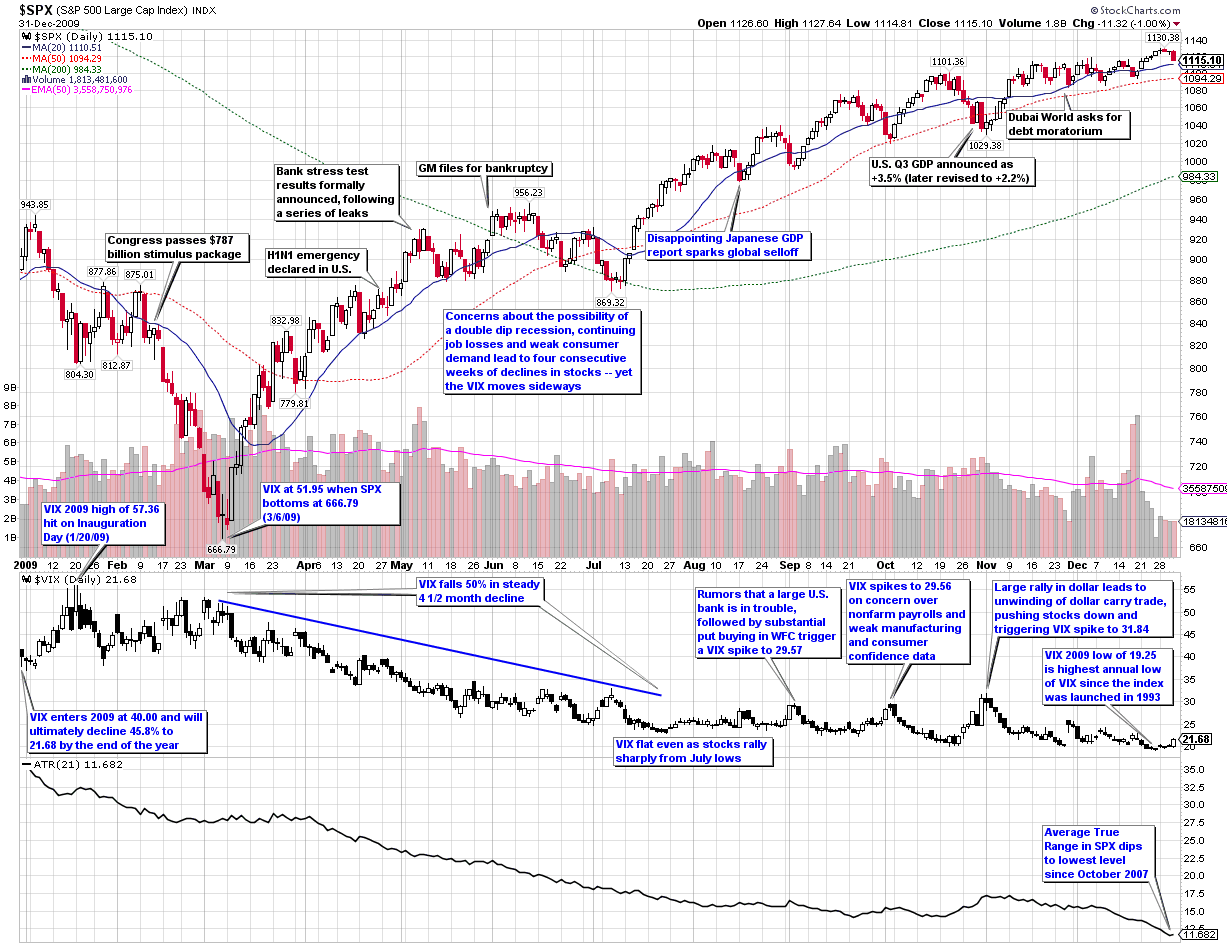
Chart of the Week: The VIX and Volatility in 2009

In this week’s chart of the week, I take a look back at the entire year as seen through the eyes of the VIX and volatility. The first thing you see in this heavily annotated chart is that while the graph of the S&P 500 index for the year looks like a checkmark (a dip down to the March lows followed by a rally), volatility as measured by both the VIX and the average true range of the SPX declined in almost a straight line over the course of the year. In other words, volatility was much less sensitive to market declines in 2009 than it had been in prior years.

Similarly, whereas the VIX peaked at 89.53 in October 2008, it was five months later before the SPX finally found a bottom. Part of the explanation for mean reversion in the VIX leading mean reversion in the SPX is likely due to behavioral finance factors such as those I described in Availability Bias and Disaster Imprinting.

Even with the less responsive VIX in 2009, the full year ended up with the second highest mean VIX for the year (31.48, behind 2008’s record of 32.68) and the highest annual low for the VIX (19.25) since the VIX was launched in 1993.

The chart shows some of the major events on the volatility landscape over the course of the year, as well as other events (black text) that had a limited impact on volatility. Notably absent from the second half of the year is any sort of sustained rise in volatility. Instead, volatility events were short-lived and with one exception, not able to push the VIX over 30. I find it interesting that while rumors of a large U.S. bank in trouble or even the Dubai debt crisis failed to elevate the VIX above 30, the one event that did push the VIX above 30 was more of a trading event (a reversal in the dollar carry trade) than an economic or geopolitical threat to stocks.

For a similar recap of the year in volatility from 2008, readers are encouraged to check out:

[source: StockCharts]

Disclosure: none

Thursday, December 31, 2009

VIX and More 2009 Year in Review

While I thought the Top Posts of 2009 captured many of the high points on the blog during the past year, I also believe it might be interesting for readers to hear about which posts were some of my favorites.

Looking back at everything I wrote in 2009, I suspect that my most important work was probably with VXX, the iPath S&P 500 VIX Short-Term Futures ETN. I believe I was the first to analyze VXX in any detail, discuss some of the shortcomings and ultimately tie it all together in Why the VXX Is Not a Good Short-Term or Long-Term Play. Along the way, I think VXX Calculations, VIX Futures and Time Decay was the piece that shaped the thinking of many investors. In terms of timeliness, VXX Juice Factor and Portfolio Insurance Implications was a warning shot I fired in the first month after VXX was launched.

While volatility declined almost in a straight line for the entire year, stocks did not. In retrospect, The Possibility of a ‘Stealth Bottom’ was one of my best predictions and my March 5th SPX at 687; Intermediate Bottom Potential Is High was only one day early.

Some of my favorite posts of the year were related to how to think about trading. The Trader Development Stage Model – Version 2.0 was a way for me to articulate some of my thinking on the subject of how traders evolve. In The Trader Development Stage Model and the Jump from Stocks to Options I liked how the model explained how and why new options traders get into trouble. A precursor to the model was a pair of posts Kafka, Surrealism and Trading and Comfort Zones, Focus and Thinking Like a Biotech Firm which address trading strategy development. Earlier in the year, Can Options Selling Make You a Better Trader? probably got the wheels turning about some of the elements of superior trading performance.

In another impromptu series of posts, I dipped my toe into behavioral finance in Availability Bias and Disaster Imprinting. The ideas from that post became much more compelling when I tied them back to the VIX in The VIX:VXV Ratio, Availability Bias and Disaster Imprinting and later in VIX Data to Support Availability Bias and Disaster Imprinting Hypothesis.

It turns out that the behavioral finance posts and several posts on realized volatility shared some analytical ideas. In The Gap Between the VIX and Realized Volatility I posted my what I believe is my first graphical representation of the difference between the VIX and realized volatility. When that extended gap finally came to an end, I posted about it in Chart of the Week: No More Free Lunch for Volatility Sellers?

With other voices now regularly discussing the VIX, I don’t feel the need to post on that subject as much as I once did, but my incredulity recently boiled over in The VIX Spike Conundrum after I saw many pundits essentially suggesting that investors panic along with the crowd.

Last but not least, two of my favorite humorous interludes were Roubini and the VIX and Blogging Network a Better Buy than Business Week?

On a personal note, I am delighted to say than in many instances it was reader comments and private emails which provided the inspiration and kicked started a dialogue of ideas that eventually resulted in some of these posts. I continue to be surprised by the extent to which blogging is a collaborative process and am thankful to all who have made my life richer in 2009 by sharing their questions and insights.

Disclosure: none

Monday, December 28, 2009

Top Posts of 2009

As this blog starts to get a little long in the tooth, I am having more fun scanning the archives to see what I was writing about and readers were responding to as various events were pushing the markets up and down.

This marks the third year I have assembled my top posts of the year collection, which represents the 25 posts of 2009 which have been read by the largest number of unique readers during the course of the year:

  1. Chart of the Week: Might Recent Volume Bottom Doom Stocks?
  2. SPX 15% Over 200 Day Moving Average for First Time in Ten Years
  3. How to Trade the VIX
  4. Lagging Semiconductor Index Suggests Caution
  5. The SPX and the 200 Day Moving Average
  6. Trader Development Stage Model – Version 2.0
  7. Draft Trader Development Stage Model
  8. VIX:VXV Ratio Sell/Short Signal
  9. The Possibility of a ‘Stealth Bottom’
  10. VIX at Seasonal Cycle Low
  11. On Trading Rules and Guidelines
  12. Three Fear Indicators (or…The Three Baritones)
  13. VXX Calculations, VIX Futures and Time Decay
  14. Chart of the Week: Change of Trend in Cash Holdings?
  15. Lost in Translation: VXX and VXZ
  16. VIX:VXV Ratio Moving Toward Bearish Zone
  17. Equity Put to Call Ratio Hits Ten Month Low
  18. VIX Spike of 35% in Four Days is Short-Term Buy Signal
  19. New Dr. Brett Series on Lessons for Developing Traders
  20. Triple ETF Options Landscape
  21. Cash on Sidelines Headed Back to Stocks?
  22. Eerie Déjà Vu as Both VIX and SPX Jump More than 2.5%
  23. Options Expiration Weeks and the March to August Bull Market
  24. Learning About Options (1)
  25. Commercial Real Estate Problems Piling Up

For the record, the top 25 posts for 2007 and 2008 are pinned to the right hand column of the blog and can also be plucked from the archives at:

Alternatively, readers looking for a month-by-month review of the past three years may be interested in The Post of the Month: An Informal History of VIX and More

Disclosure: none

DISCLAIMER: "VIX®" is a trademark of Chicago Board Options Exchange, Incorporated. Chicago Board Options Exchange, Incorporated is not affiliated with this website or this website's owner's or operators. CBOE assumes no responsibility for the accuracy or completeness or any other aspect of any content posted on this website by its operator or any third party. All content on this site is provided for informational and entertainment purposes only and is not intended as advice to buy or sell any securities. Stocks are difficult to trade; options are even harder. When it comes to VIX derivatives, don't fall into the trap of thinking that just because you can ride a horse, you can ride an alligator. Please do your own homework and accept full responsibility for any investment decisions you make. No content on this site can be used for commercial purposes without the prior written permission of the author. Copyright © 2007-2023 Bill Luby. All rights reserved.
 
Web Analytics