Showing posts with label behavioral finance. Show all posts

Monday, November 19, 2012

Guest Columnist at The Striking Price for Barron’s: Calm Down and Exploit Others’ Anxieties

On Wednesday I had an opportunity to serve as a guest columnist for The Striking Price on behalf of Steven Sears at Barron’s for the eighth time, focusing my attention on some of the early findings from the VIX and More Fear Poll in Calm Down and Exploit Others’ Anxieties.

In some respects, the most recent Barron’s article is a companion piece to another Barron’s article I penned in May: Be Greedy While Others Are Fearful. This time around I delve into some of the emerging behavioral finance aspects of the survey results, specifically related to geographical and temporal proximity bias. I also discuss the merits of a SPY short straddle trade as well as long VIX puts as a means to take advantage of some market distortions due to that bias.

As far as the most recent Fear Poll goes, this week the race for the top spot looks as if it will go down to the wire and for the first time so far, there are more than two viable candidates for the top slot. [If you have not voted in the weekly poll yet, now is as good a time as any…]

Related posts:

A full list of my Barron’s contributions:

Disclosure(s): none

Monday, October 18, 2010

Expiring Monthly October 2010 Issue Recap

Just a quick reminder that the October issue of Expiring Monthly: The Option Traders Journal was published today and is available for subscribers to download.

This month I authored two pieces that I think readers might find particularly interesting. The first is the monthly feature, Fear and Loathing in October, which examines seasonality from an anecdotal, statistical and a behavioral finance perspective and puts the September through January period under the analytical microscope. Also of interest is the third and final installment in my series on the VIX futures term structure. VIX Futures: Putting Ideas into Action takes a six-part framework for analyzing VIX futures and discusses some of the implications for trading VIX options and VIX ETNs such as VXX.

I have reproduced a copy of the Table of Contents for the October issue below for those who may be interested in learning more about the magazine. Subscription information and additional details about the magazine are available at http://www.expiringmonthly.com/.

Related posts:


[source: Expiring Monthly]

Disclosure(s): I am one of the founders and owners of Expiring Monthly

Monday, August 16, 2010

Three Books for Approaching Behavioral Finance

In my recent travels I plucked two behavioral finance books out of airport bookstores. Apparently Blink has triggered a new title and jacket aesthetic, as both of these books look as if they could have been companion volumes.

The quickest read of the bunch, Sway: The Irresistable Pull of Irrational Behavior (Ori Brafman and Rom Brafman), can easily be polished off in a three-hour flight. Frankly, this is the book’s main attraction, but also its weakness. Here is an entertaining read that provides a vignette-centric approach to illuminating the decision-making shortfalls humans are prone to making. Theories and conclusions are loosely woven around the vignettes to provide structure and coherence, yet most of these are self-explanatory from the examples. Sway has the readability of Freakonomics and is just as likely to be consumed in one sitting, but ultimately does little more than whet the appetite for anyone with an interest in getting to the full menu of behavioral finance. As an hors d'oeuvre, however, it is most enjoyable.

At first glance, Nudge: Improving Decisions About Health, Wealth and Happiness (Richard Thaler and Cass Sunstein), looks to be an only slightly heartier meal. In fact, Nudge retains the readability of Sway, but is much more comprehensive, better organized and yet has the heft of an academic introduction to behavioral finance. Nudge will probably require an overseas flight to digest, and is better suited for savoring over the course of multiple sittings.

In another league entirely is the encyclopedic Choices, Values, and Frames (Daniel Kahneman and Amos Tversky), which is a comprehensive collection of articles that represent the definitive thinking on much of the field of behavioral finance, which Kahneman and Tversky were instrumental in establishing. One could argue that Choices, Values, and Frames was the book which was largely responsible for Kahneman being awarded the Nobel Prize following Tversky’s death. This book is a densely packed buffet of ideas that is probably best consumed in small chunks over the course of weeks or months. It is not necessarily an easy read, but the ideas and research that went into it and the reflection and rethinking of the investment world that come out of it make it one of the most influential books in the realm of finance and investments.

Related posts:

Disclosure(s): none

Thursday, December 31, 2009

VIX and More 2009 Year in Review

While I thought the Top Posts of 2009 captured many of the high points on the blog during the past year, I also believe it might be interesting for readers to hear about which posts were some of my favorites.

Looking back at everything I wrote in 2009, I suspect that my most important work was probably with VXX, the iPath S&P 500 VIX Short-Term Futures ETN. I believe I was the first to analyze VXX in any detail, discuss some of the shortcomings and ultimately tie it all together in Why the VXX Is Not a Good Short-Term or Long-Term Play. Along the way, I think VXX Calculations, VIX Futures and Time Decay was the piece that shaped the thinking of many investors. In terms of timeliness, VXX Juice Factor and Portfolio Insurance Implications was a warning shot I fired in the first month after VXX was launched.

While volatility declined almost in a straight line for the entire year, stocks did not. In retrospect, The Possibility of a ‘Stealth Bottom’ was one of my best predictions and my March 5th SPX at 687; Intermediate Bottom Potential Is High was only one day early.

Some of my favorite posts of the year were related to how to think about trading. The Trader Development Stage Model – Version 2.0 was a way for me to articulate some of my thinking on the subject of how traders evolve. In The Trader Development Stage Model and the Jump from Stocks to Options I liked how the model explained how and why new options traders get into trouble. A precursor to the model was a pair of posts Kafka, Surrealism and Trading and Comfort Zones, Focus and Thinking Like a Biotech Firm which address trading strategy development. Earlier in the year, Can Options Selling Make You a Better Trader? probably got the wheels turning about some of the elements of superior trading performance.

In another impromptu series of posts, I dipped my toe into behavioral finance in Availability Bias and Disaster Imprinting. The ideas from that post became much more compelling when I tied them back to the VIX in The VIX:VXV Ratio, Availability Bias and Disaster Imprinting and later in VIX Data to Support Availability Bias and Disaster Imprinting Hypothesis.

It turns out that the behavioral finance posts and several posts on realized volatility shared some analytical ideas. In The Gap Between the VIX and Realized Volatility I posted my what I believe is my first graphical representation of the difference between the VIX and realized volatility. When that extended gap finally came to an end, I posted about it in Chart of the Week: No More Free Lunch for Volatility Sellers?

With other voices now regularly discussing the VIX, I don’t feel the need to post on that subject as much as I once did, but my incredulity recently boiled over in The VIX Spike Conundrum after I saw many pundits essentially suggesting that investors panic along with the crowd.

Last but not least, two of my favorite humorous interludes were Roubini and the VIX and Blogging Network a Better Buy than Business Week?

On a personal note, I am delighted to say than in many instances it was reader comments and private emails which provided the inspiration and kicked started a dialogue of ideas that eventually resulted in some of these posts. I continue to be surprised by the extent to which blogging is a collaborative process and am thankful to all who have made my life richer in 2009 by sharing their questions and insights.

Disclosure: none

Friday, December 4, 2009

New Dr. Brett Series on Lessons for Developing Traders

If there is one blog on the web where I never seem to find the appropriate amount of time required to digest all the nuggets of wisdom it contains, that site is undoubtedly Brett Steenbarger’s TraderFeed. Filled with insights that range from quantitative analysis and system development to what is arguably the best collection of content on the web in the realm of trader psychology, TraderFeed continues to be – at least in my opinion – the top all-purpose investment blog on the web.

For this reason, when Brett mentioned in Lessons for Developing Traders: What Moves Markets that he is “going to write about topics that no one told me about when I was learning the ropes,” I thought that instead of waiting until the series is finished to highlight it I would flag it now for anyone who is not already on the Steenbarger bandwagon.

This new series also got me thinking to about the three things I wish I had been told (assuming I was smart enough to follow that advice) at the beginning of my trading career. The answers are personal ones, but I believe they capture insights that led to quantum advances in my trading:

  1. Standardize on one time horizon…and make it consistent with your trading approach and personality

  2. Make research and analysis of risk management at least as important as R&D on stocks, indicators and strategies

  3. Focus more time on developing expertise in managing (and exiting) existing positions than on discovering new high potential entries

For the record, a close fourth in this exercise was understanding the tenets of behavioral finance and the associated decision-making pitfalls that investors should learn to avoid. Those who wish to get a better sense of how I see the learning process for developing traders may wish to investigate my trader development stage model.

Readers, feel free to use the comments section to spell out the 3-4 things you wished someone had told you when you first started trading.

For more on these subjects, readers are encouraged to check out:

Disclosure: none

Wednesday, November 11, 2009

VIX Data to Support Availability Bias and Disaster Imprinting Hypothesis

At the risk of beating to death last week’s theme of availability bias and disaster imprinting as part of the explanation for some of the “realized volatility gap, persistent VIX futures contango and off-center VIX:VXV ratio,” I thought it might be informative to present a simple piece of research which supports the idea that the 2009 volatility picture has been an extremely abnormal one.

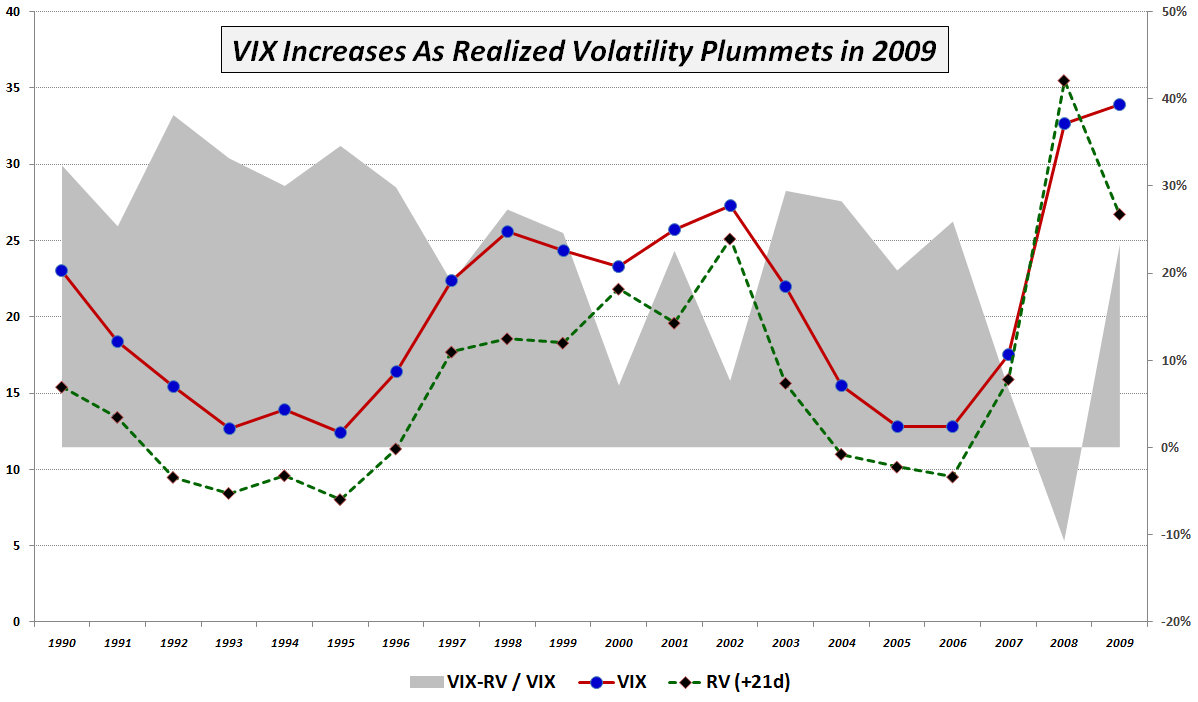
In the 20 years of VIX historical data, the VIX has typically overestimated the realized volatility 21 trading days hence, which is reflected in the chart below by the dotted green RV (+21d) line. In fact, the gray area portion of the graphic, which represents the difference between the VIX and realized volatility 21 trading days later, was close to 30% in the first half of the 1990s; more recently it has been averaging closer to 20%. The VIX actually fell below realized volatility for 2008, which is not surprising, given the volatility extremes of October and November. What is particularly noteworthy about this chart, however, is that during 2009 the VIX is actually 3.8% higher than it was in 2008, which realized volatility has actually fallen 24.7%. It is almost as if the VIX refuses to believe that realized volatility is declining and insists that the gravitational forces of mean reversion be suspended until further notice. This is a large part of the reason why 2009 has been a boon to options sellers.

For additional posts in this series, which I have listed in reverse chronological order, readers are encouraged to check out:

Thursday, November 5, 2009

Open Thread: How Has Your Trading Changed?

My recent foray into issues of investor psychology and behavioral finance assumes that traders have learned a number of lessons and/or changed the way they trade as the result of the events of the last year or two.

So...in what ways has your trading changed? What lessons have you learned? How are you different as an investor now than you were before the Lehman Brothers fiasco?

Tuesday, November 3, 2009

Availability Bias and Disaster Imprinting

After I dashed off The VIX Spike Conundrum, it occurred to me that there might be some aspects of behavioral finance that have contributed to what is now a full year of continued overestimating of future volatility. I detailed this phenomenon in The Gap Between the VIX and Realized Volatility and is also being reflected in up in a VIX:VXV ratio that has been stuck at unusually low levels from mid-July until last week.

In thinking about the various elements of behavioral finance that impair ‘rational’ decision-making and could contribute to excess implied volatility, one factor that immediately comes to mind is availability bias (nicely summarized in Wikipedia.) The global financial crisis and VIX spikes into the 80s were so vivid and memorable – and so thoroughly discussed in the media – that they are all too easy to recall one year later, even though arguably most of the risks associated with a VIX of 80 have since passed.

I do not think that availability bias is the only explanation for recent excess implied volatility. My working hypothesis – which I do not believe has been addressed by the behavioral finance crowd – is that another factor is as work. I call it “disaster imprinting” for lack of a better name. Disaster imprinting refers to a phenomenon in which the threats of financial and psychological disaster were so severe that they continue to leave a permanent or semi-permanent scar in one’s psyche. Another way to describe disaster imprinting might be to liken it to a low level financial post-traumatic stress disorder.

I will do some additional research to test the disaster imprinting theory, but for now I wanted to throw the idea out and see what others think. Has going to the brink of a global financial meltdown impaired our collective ability to assess future probabilities? If so, how long will this impairment last? As always, all comments are appreciated.

For additional posts on related subjects, readers are encouraged to check out:

Disclosure: Short VIX at time of writing.

Wednesday, October 21, 2009

Anchoring and a VIX of 20

I can’t quite decide whether to be delighted or puzzled that so many people seem to care that the CBOE Volatility Index (VIX) is approaching 20. In truth, I feel a little bit of each. When I started this blog, I decided to devote a fair amount of attention to this unusual statistic that very few people were aware of and most that did had stopped paying attention to out of boredom. Of course the VIX was at about 10 then, the markets were awash in liquidity, and following a volatility index felt about as useful as trying to estimate Usain Bolt’s times with a sundial.

Fast forward three years and many things have changed. I can certainly appreciate the role the VIX played in trying to help the masses quantify fear in the midst of the financial crisis. When the VIX hit 50, 60, 70 and 80, these new highs sent a message that the situation was getting worse – or that investors were willing to pay dearly to protect themselves from the many potential disaster scenarios looming on the horizon.

A funny thing happened when the markets started to recover. We started to hear a variety of opinions that the VIX was too low, that substantial risks still remained, etc. The “VIX is too low” argument has been heard for several months now, but it seems to be gathering steam as the VIX approaches 20.

More than 35 years ago, Amos Tversky and Daniel Kahneman wrote a seminal piece on anchoring called Judgment Under Uncertainty: Heuristics and Biases. In the words of the authors:

“In many situations, people make estimates by starting from an initial value that is adjusted to yield the final answer. The initial value, or starting point, may be suggested by the formulation of the problem, or it may be the result of a partial computation. In either case, adjustments are typically insufficient. That is, different starting points yield different estimates, which are biased toward the initial values. We call this phenomenon anchoring.”

This is the same line of thinking practiced by investors who watch GOOG hover around the 450 mark for week after week, thinking they will wait until the stock falls to 400 to buy it on the cheap. The problem is that when GOOG moves over 500, all that anchoring around the 450 has conditioned the brain to think that 500 is too expensive, no matter how much GOOG rallies from that level.

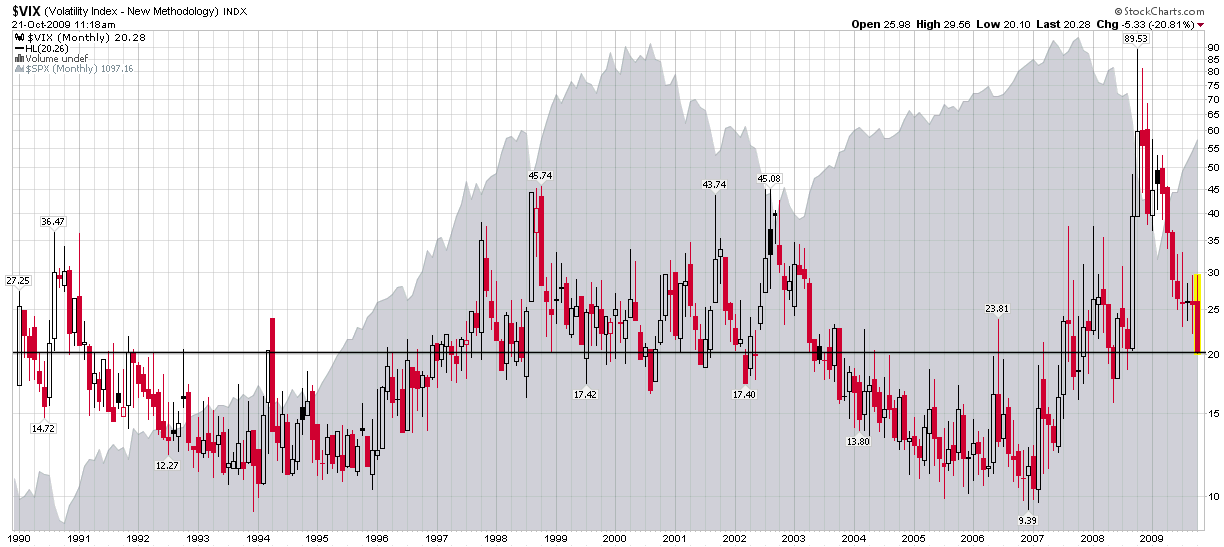
Turning to the VIX, not only have all those readings in the 30s, 40s and 50s been recently imprinted into the investor’s psyche, but so also has all the emotional turmoil associated with the financial crisis and stock market crash. Even if things are better, the argument goes, can they possibly be this much better so soon after the global financial system was teetering on the edge of a cliff? The short answer is that anchoring makes it difficult for many investors to adapt to new price ranges and a new set of circumstances as situations change. It is part of the reason why bulls cling to hope on the way down and perma-bears have difficulty changing their bias when the market bounces. Finally, it is why so many people seem to be incredulous that the VIX is almost down to 20.00 when the lifetime (20 year) moving average for the volatility index is 20.26. In terms of volatility, we are right at the VIX’s lifetime moving average, which means investors are pricing in an average amount of risk and uncertainty – in historical terms – at the moment.

Of course, if one were to be anchored in the last 12 months, the VIX would be at an all-time low. Conversely, if one were anchored in the period from 2004-2006, the VIX would be in the 99th percentile, almost at an all-time high.

So…pull up the anchor and set your sails for the new volatility environment.

[source: StockCharts]

Wednesday, July 30, 2008

Implied Volatility and Magnitude vs. Direction

Awhile back, a reader posed what sounded like a basic question:

Isn't implied volatility a function of the size of the move, rather than direction? So why is VIX more commonly referred to as a fear index if high VIX can imply movements in both directions? I mean- HOW and exactly where does the direction get factored into VIX?

This question sounds as if it if might have an easy answer. The problem is that when you scratch the surface of implied volatility, a bunch of other questions have a tendency to pop up and all the tangents make it easy for the questioner’s eyes to glaze over. So, to make a long story a little shorter, I have decided that it is time to draft some detailed posts that look under the hood at both implied volatility and historical/statistical volatility. Not to worry, this won’t happen today; more likely I will tackle these subjects over the course of the next two or three weeks in a series of posts.

Getting back to the questions posed above, to set the context, historical volatility (also known as statistical volatility) looks backward at actual historical price movements and calculates volatility in terms of standard deviations over a given period of time. The result is expressed as an annualized volatility number (the percentage of one standard deviation), just like the VIX. Historical volatility does not care about the direction of the volatility, only the magnitude.

In theory, implied volatility should also be directionally agnostic. Investor psychology and the mechanics of the options marketplace, however, mean that reality diverges from theory as options are transacted. Recall that implied volatility is derived from actual options prices. When the other options pricing variables (strike price; price of the underlying; time to expiration; dividends; and risk free interests rate) of an option are frozen, this leaves implied volatility as the only remaining variable in the options pricing equation. This is how implied volatility is derived.

In the very short term, options prices are largely a function of the price of the underlying and implied volatility, as the other variables tend to change at a slow and/or predictable rate. When the price of the underlying is relatively stable, implied volatility has a tendency to drift down and bring options prices with them. When the price of the underlying (whether it be a stock, ETF, index or whatever) moves sharply, this is when things get interesting. If the underlying moves up quickly, it has a tendency to attract new buyers and sellers. Implied volatility usually rises with the move and so do most options prices. Ultimately, implied volatility becomes a function of supply and demand for options at specific strikes and expirations. If new transactions keep hitting the ask price, then options prices will move quickly and implied volatility will adjust upward to accommodate the new prices. Sellers will also be inclined to keep raising their asking price to account for this demand – again stretching prices and pulling implied volatility along for the ride. Generally, this will not result in a “panic buying” situation, particularly if the underlying is an index or an ETF. Greed is not instantaneous; it tends to build over time. There might be a concern with an individual stock that an acquisition is in the works, a legal matter has been settled, word of an FDA decision has leaked out, etc., but other than these scenarios (which do not apply to an index or an ETF), sharp upward moves tend to be orderly and have a relatively limited short-term psychological impact on the investor.

If you turn this scenario around and think of the move as a sharp selloff, some different dynamics come into play. First consider the maxim that stocks tend to fall faster than they rise. Second, when it comes to portfolio protection, the rush to buy puts to protect an existing position is much more dramatic than any sort of call purchases during a bull spike. Third, the worst case scenario for a bear move includes not only the scenarios noted in the paragraph above, but incorporates any number of potential disasters from a CEO/CFO resignation to accounting irregularities, lowered earnings guidance, new legal challenges, etc. Fourth, as the downward move gathers momentum, investors have a tendency to buy whatever puts they can, at the market, for whatever prices are available. It is this insensitivity to prices during a panic selling situation that tends to overwhelm the ask price and cause market makers to raise the prices of puts dramatically; this, in turn, triggers a sharp jump in implied volatility.

Ultimately, the same aspects of investor psychology and behavioral finance (i.e., loss aversion) that translate into more panic selling than panic buying also mean that the supply and demand imbalance for options is typically greater in sharp bear moves than in sharp bull moves. The result is that implied volatility tends to spike more with an X% drop than as a result of an X% rise. Statistically, these moves are identical, but psychologically and from a transaction perspective, spikes down will generally move implied volatility more than comparably sized spikes up. Since the VIX is essentially the implied volatility of the SPX, this is one of the reasons why the magnitude and direction of a market move determine the impact the move will have on the VIX.

Monday, June 18, 2007

The Risk Library

Two weeks ago I offered up “Ten Anecdotal/Historical Book Ideas for Investors” on the premise that humans have a tendency to learn and retain more valuable concepts when the learning process is enjoyable.

This list is quite different. Risk is something that the novice trader/investor invariably fails to think about enough and properly address in their trading methodology. Interestingly, risk management is often the Achilles heel of more experienced traders who know better, but also fail to attend to with sufficient rigor.

With this in mind, I offer up some favorites from my personal library to help all traders think about risk and act to limit the risks inherent in their trading strategies, ordered roughly from the most abstract to the most prescriptive, which I often find is an excellent way to tackle any unfamiliar subject:

Against the Gods (Peter Bernstein) – A high level survey of the history of risk from the perspective of the advance of civilization. A relatively quick read that should inspire the desire to take a closer look at risk vis-Ă -vis investments. 

The (Mis)Behavior of Markets (Benoit Mandelbrot) – A fun and mind-expanding stew of financial risk, fractals and chaos theory. A great thought starter and surprisingly easy for non-math/physics scholars to breeze through.

Fooled By Randomness (Nassim Taleb) and The Black Swan (Nassim Taleb) – I suggest you try these in chronological order, starting with Fooled By Randomness. If Bernstein and Mandelbrot offer up two solid thought starters, then Taleb is a master of throwing gasoline on the fire. Deftly written in his own idiosyncratic narrative, Taleb’s books are bursting at the seams with ideas and ground zero is risk.

Choices, Values, and Frames (Daniel Kahneman and Amos Tversky) – Behavioral finance is a subject that is still gaining traction, but the sooner you steep your thinking in the ideas of the discipline’s founding fathers, Kahneman and Tversky, the better off you will be. This particular book is a collection of essays that you can read through at your own pace.

Manias, Panics, and Crashes (Charles Kindelberger) and/or Devil Take the Hindmost (Edward Chancellor) – Kindleberger offers a dense but informative history, while Chancellor wins out in terms of readability. Each is an excellent account of the history of speculation and market excesses; picking one of the two would probably suffice. Note that Charles MacKay’s Extraordinary Popular Delusions and the Madness of Crowds should also probably be on this historical menu, but I have not yet read it.

With Fortune’s Formula (William Poundstone), this list passes over from the largely theoretical into the prescriptive realm. This is a fun read on the Kelly criterion, set to a backdrop of blackjack and casino gambling.

A Thousand Barrels a Second (Peter Tertzakian) and/or The Oil Factor (Stephen Leeb) – There are many books out there that discuss the merits of Peak Oil. I have only read a few of them, but Tertzakian’s treatment is by far my favorite and certainly one of the more objective ones. Leeb’s book probably created a larger stir (as did his The Coming Economic Collapse, which strikes me as little more than a hastily assembled slight update of his previous book), but it covers most of the important points in much smaller bites. Every investor, Peak Oil proponent or otherwise, needs to take a close look at this subject and be prepared for how a number of oil-related scenarios may play out over the remainder of their investment time horizon.

Financial Shenanigans (Howard Schilit) – The subtitle of the book, How to Detect Accounting Gimmicks & Fraud in Financial Reports is exactly what this book is all about. Here is a fundamental approach that addresses what to look for, with an excellent treatment by Schilit. It is up to the reader to determine whether these companies should merely be avoided or whether they might also be short candidates.

How to Make Money Selling Stocks Short (William O’Neil and Gil Morales) – This is another prescriptive book and it relies entirely on a couple of basic technical analysis concepts. Even with that shortcoming, I think the true value of the book is that it will help you to actively look for short opportunities and avoid the confirmation bias that long-only approaches can sometimes succumb to. For example, if stock chart is screaming “buy” at you, would it be a “sell” if you turned the chart upside down?

When to Sell (Justin Mamis) and/or It’s When You Sell that Counts (Donald Cassidy) – While it is easy to find books on how to buy stocks, good luck finding an entire book devoted to the topic of selling them. Mamis and Cassidy are the only two books of this kind I have encountered and fortunately each offers an excellent treatment of the subject. I am slightly partial to Mamis here, but since most of us make or lose a lot more money managing existing positions than seeking better entries, my suggestion is to try both of them.

Trading Risk (Kenneth Grant) – This book is the only one I know of that offers highly detailed advice about how to evaluate the various types of risk in your holdings and take action to mitigate those risks. If I could, I would make it required reading for any newcomer to the investment world.

DISCLAIMER: "VIX®" is a trademark of Chicago Board Options Exchange, Incorporated. Chicago Board Options Exchange, Incorporated is not affiliated with this website or this website's owner's or operators. CBOE assumes no responsibility for the accuracy or completeness or any other aspect of any content posted on this website by its operator or any third party. All content on this site is provided for informational and entertainment purposes only and is not intended as advice to buy or sell any securities. Stocks are difficult to trade; options are even harder. When it comes to VIX derivatives, don't fall into the trap of thinking that just because you can ride a horse, you can ride an alligator. Please do your own homework and accept full responsibility for any investment decisions you make. No content on this site can be used for commercial purposes without the prior written permission of the author. Copyright © 2007-2023 Bill Luby. All rights reserved.
 
Web Analytics