Showing posts with label LSC. Show all posts

Tuesday, August 3, 2010

Wheat and the Commodity ETF Space

Anyone with even a passing interest in commodities has no doubt taken notice that the worst drought in Russia in at least 50 years, coupled with climatological excesses around the globe which have created a substantial disruption in the supply of agricultural commodities, most notably in wheat.

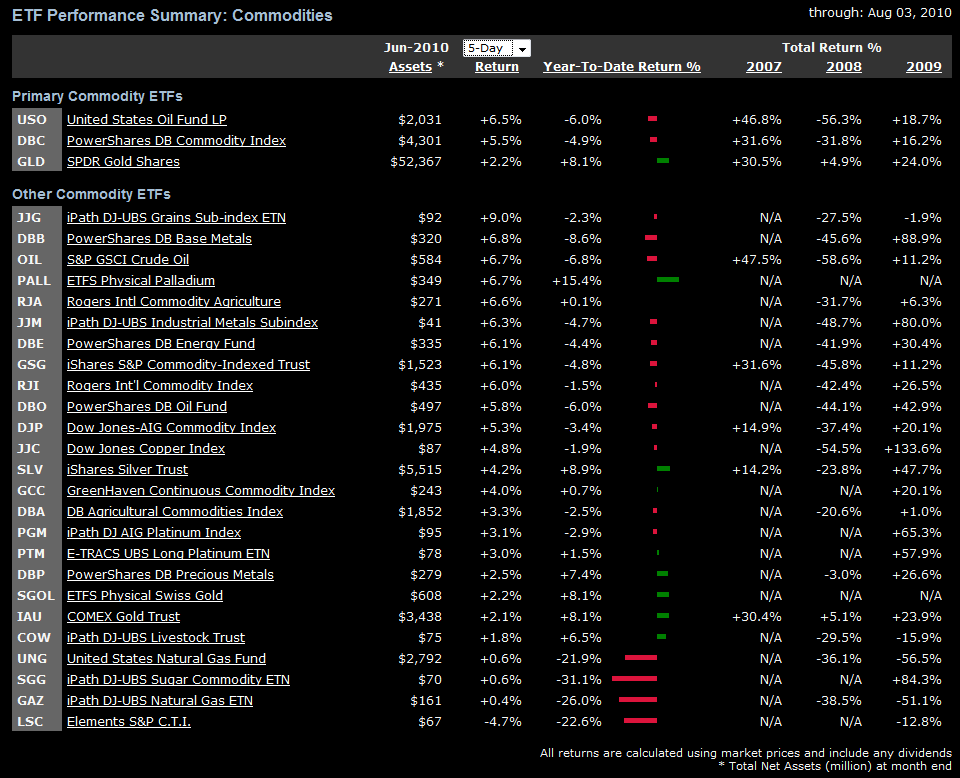
The graphic below from ETFreplay.com summarizes some of the impact on selected commodity ETFs and ETNs over the course of the past week. Note that JJG, the iPath Dow Jones-UBS Grains Total Return Sub-Index ETN, is up 9% in the past week and broader commodity and agricultural ETFs such as RJA and DBC have also been lifted significantly by the surge in agricultural futures prices.

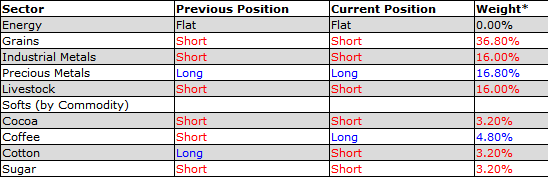
In addition to JJG, investors looking for a grain-specific ETF/ETN may also wish to check out GRU, the ELEMENTS MLCX Grains Index Total Return ETN. As noted last Friday, investors can also take a long position in grains by shorting the ELEMENTS S&P Commodity Trends Indicator ETN (LSC), where 36.8% of the ETN is currently short grains.

For more on related subjects, readers are encouraged to check out:


[source: ETFreplay.com]

Disclosure(s): long JJF and short LSC at time of writing

Friday, July 30, 2010

LSC Long-Short Commodities ETF Struggling Mightily

Launched in June 2008, the ELEMENTS S&P Commodity Trends Indicator ETN (LSC) was an immediate hit with retail investors, attracting a considerable volume, offering diversification from an equity-heavy portfolio and even using a long-short approach to take advantage of both bullish and bearish trends in commodities. By the end of the 2008, the ETF was already up more than 6%.

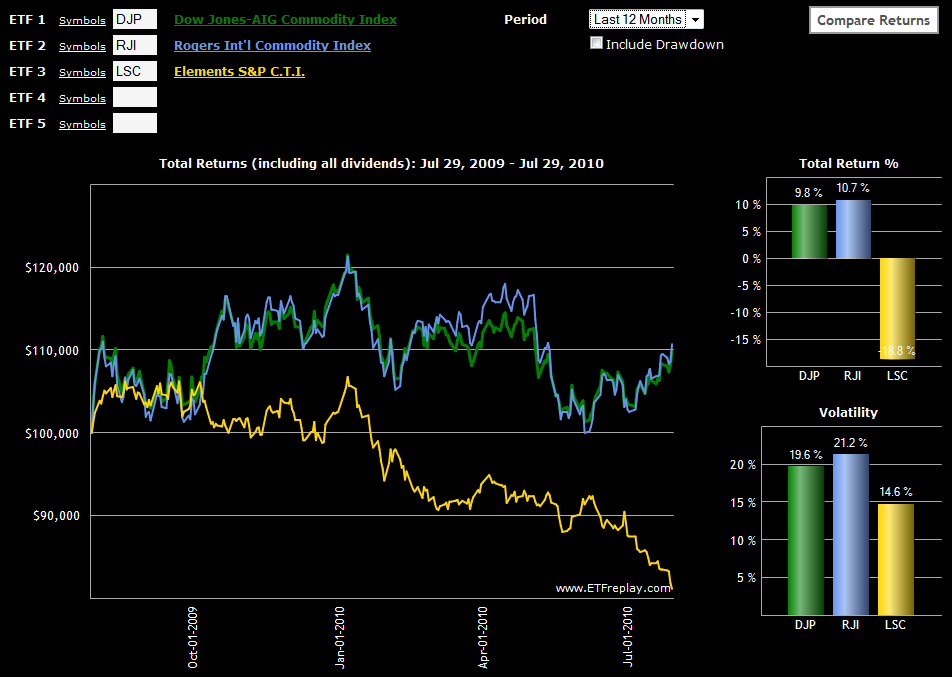
Unfortunately, since the end of 2008 the ETF has been steadily losing ground and is now down 44% from its 2008 high water mark. The graphic below, from ETFreplay.com, shows LSC’s performance relative to broadly diversified commodity ETFs, RJI and DJP over the course of the last year. While the graphic alone may make LSC appear to be an attractive short, I think it is important to note that the prospectus has historical data going back to 2001 which shows excellent long-term performance characteristics.


A look under the hood shows that LSC’s trend following approach uses a 7-month exponential moving average (EMA) to evaluate trends in the following 16 commodity futures contracts:

  • Wheat (CBOT: W)
  • Corn (CBOT: C)
  • Soybeans (CBOT: S)
  • Cotton (NYCE: CT)
  • Cocoa (CSCE: CC)
  • Sugar (CSCE: SB)
  • Coffee (CSCE: KC)
  • Live Cattle (CME: LC)
  • Lean Hogs (CME: LH)
  • Copper (COMEX: HG)
  • Gold (COMEX: GC)
  • Silver (COMEX: SI)
  • Heating Oil (NYMEX: HO)
  • Light Crude Oil (NYMEX: CL)
  • RBOB Gasoline (NYMEX: XB)
  • Natural Gas (NYMEX: NG)

Based on where the commodities are relative to the EMA, the ETF will go long or short, or have a neutral position. The one exception is crude oil, where the ETF is only allowed to be long or flat. The prospectus lays out the rationale for the short restriction on crude oil as follows:

Energy, due to the significant level of its continuous consumption, limited reserves, and oil cartel control is subject to rapid price increases in the event of perceived or actual shortages. For example, although a problem of this magnitude has not occurred historically, if the Index were capable of shorting the energy sector and a catastrophe occurred which caused Light Crude prices to surge dramatically while the energy Sector allocation was set to short, the Index would lose a significant portion of its value on the Light Crude position alone. Because no other sector is subject to the same continuous demand with supply and concentration risk, the energy sector is never positioned short in the Index.

LSC evaluates all futures contracts at the end of each month and makes any new long-short decisions at that time. The current (July) positions of LSC are as follows:


Those interested in additional information on LSC should try:

Going forward, I think the “…and More” portion of this blog will begin to place increased emphasis on the commodity space, including ETFs, futures and options on commodities.

As an aside, there are two new ETF sites that have recently launched which offer a great deal of promise to ETF investors:

For more on related subjects, readers are encouraged to check out:

[sources: ETFreplay.com, ELEMENTS/Merrill Lynch]

Disclosure(s): short LSC at time of writing

Tuesday, October 20, 2009

Diving a Little Deeper into the Strategy-in-a-Box ETFs

I was sufficiently pleased by the response to my strategy-in-a-box ETFs post that it seems appropriate to launch a follow-up post to address several questions raised or implied by readers. The biggest issues seemed to revolve around the history, performance and holdings of these ETFs. It is also important to understand the nature of the index and/or strategy that the ETF seeks to replicate, as well as the timing and methodology used to rebalance the ETFs. For each of the six aforementioned strategy-in-a-box ETFs, I have therefore also included links to a profile/summary page; the prospectus; a current list of holdings; the Morningstar performance data; and the StockCharts gallery chart:

As noted on Sunday, all but LSC have at least two years of a track record. Normally I would not consider this to be a long time, but given that it covers both strong bull and bear markets, I believe it is an appropriate time period from which to draw some conclusions. Perhaps more interesting is the rebalance period, where quarterly rebalancing seems to be the norm. I have spent a fair amount of time playing with various rebalancing methods and at least in my experience, I find it difficult to gain a meaningful edge with quarterly rebalancing.

Finally, it looks as if the strategy-in-a-box moniker is here to stay. I guess it is just a matter of time before I roll out screw top, synthetic cork and real cork strategies. Perhaps then we can turn our attention to the next dimension, Jeroboam, Methuselah and Nebuchadnezzar strategies…

[For all of you who think I may be spending too much time near the fermentation tanks, it was only two years ago that my weekly volatility analysis came with a wine pairing…]

Sunday, October 18, 2009

Chart of the Week: Strategy-in-a-Box ETFs

With interest growing in actively managed ETFs, there is another category of ETFs (and ETNs) out there which I believe has been unfairly overlooked by most investors. I do not have a name for these ETFs, but rather than represent asset classes, sectors, geographies, and other typical ETF constructs, they seek to replicate specific investment strategies. Until someone tags them with a better name, I am going to call them strategy-in-a-box ETFs.

Depending upon how you define the strategy-in-a-box concept, you can find various ETFs that may or may not conform to that definition, but six that clearly fit the profile, have attracted some investor interest and that I try to monitor are:

  • Elements S&P CTI ETN (LSC) – a long-short commodity technical momentum ETF
  • Claymore/Sabrient Insider ETF (NFO) – targets companies where there are favorable corporate insider buying trends and recent earnings estimate increases by Wall Street analysts
  • PowerShares DWA Technical Leaders (PDP) – focuses on companies exhibiting strong relative strength as measured by Dorsey Wright & Associates Technical Leaders Index
  • PowerShares Value Line Industry Rotation (PYH) – is based on the Value Line Industry Rotation Index, which is derived from Value Line’s measure of stock timeliness and industry timeliness
  • PowerShares Value Line Timeliness Select (PIV) – unlike the ETF above, utilizes three core Value Line ranking systems that incorporate timeliness, technical ranking and safety
  • Claymore/Zacks Country Rotation (CRO) – which attempts to track the Zacks Country Rotation Index

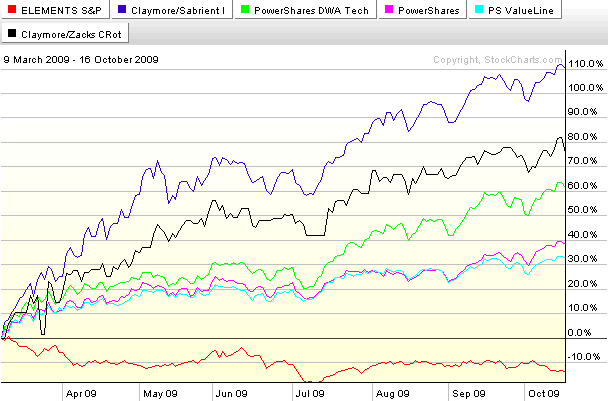
What can you do with this motley group of ETFs? For starters, since all have been around for at least 15 months (all but LSC for more than two years), you can see how some of these strategies have worked in real-time bull and bear market conditions. For instance, if you just happened to get bullish on March 9th, which of the above ETFs would have provided the best returns? The chart of the week below shows that the Claymore/Sabrient Insider ETF (NFO) has led the pack, more than doubling over the course of the past seven plus months. The second best performer has been CRO, the Claymore/Zachs Country Rotation ETF. The PowerShares DWA Technical Leaders (PDP) has returned about the same as the SPX during the bull market. Interestingly, the Elements S&P CTI ETN (LSC) has actually lost money during the strong bull market in stocks.

I will have more to say about these ETFs and about their actively managed ETF cousins going forward. In the meantime, feel free to suggest a better name than strategy-in-a-box…

[source: StockCharts]

DISCLAIMER: "VIX®" is a trademark of Chicago Board Options Exchange, Incorporated. Chicago Board Options Exchange, Incorporated is not affiliated with this website or this website's owner's or operators. CBOE assumes no responsibility for the accuracy or completeness or any other aspect of any content posted on this website by its operator or any third party. All content on this site is provided for informational and entertainment purposes only and is not intended as advice to buy or sell any securities. Stocks are difficult to trade; options are even harder. When it comes to VIX derivatives, don't fall into the trap of thinking that just because you can ride a horse, you can ride an alligator. Please do your own homework and accept full responsibility for any investment decisions you make. No content on this site can be used for commercial purposes without the prior written permission of the author. Copyright © 2007-2023 Bill Luby. All rights reserved.
 
Web Analytics