Zooming Out on Consumer Spending
By now the news that the University of Michigan Consumer Sentiment Report for April was at the lowest level since March 1982 has been almost fully digested. A number of bloggers have done an excellent job pointing out that lows in this index often coincide with lows in the stock market. Babak at Trader’s Narrative , for instance, has an excellent graph of sentiment and stocks in Consumer Sentiment Always Darkest Before the Dawn. Don Fishback’s Market Update has a similar chart up today.
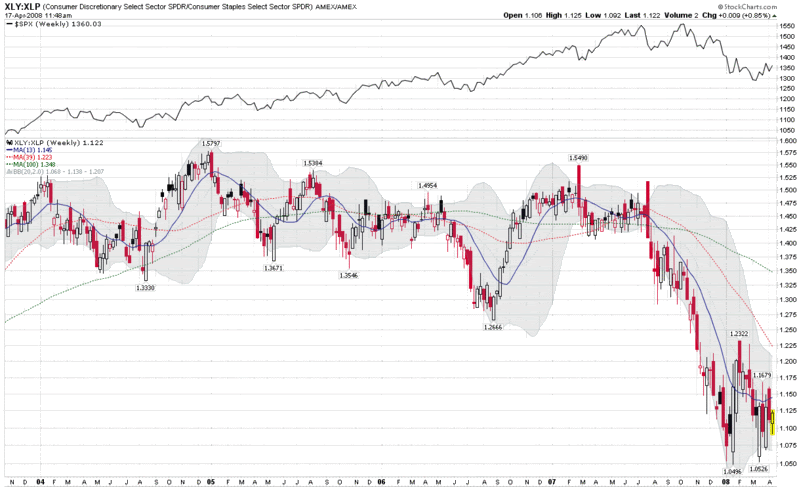
The upcoming Pennsylvania primary notwithstanding, I am going to set aside poll data for the moment and focus on one of my favorite consumer sentiment indicators: a comparison of consumer discretionary stocks to consumer staples stocks. This can easily be done with two sector ETFs, XLY (Consumer Discretionary Select Sector SPDR Fund) and XLP (Consumer Staples Select Sector SPDR Fund.) Keeping in mind that stocks are supposed to lead the economy by 6-9 months, the XLY:XLP ratio should tell us something about how stocks are pricing in expected consumer spending patterns over the next 2-3 quarters.
The XLY:XLP chart below is a weekly chart, which provides a sense of the recent ebbs and flows of consumer spending patterns. The chart demonstrates that when the ratio trends down and/or makes a significant low, these events usually coincide with market bottoms. It remains to be seen whether this pattern will hold in the current economic environment, but there are signs that the consumer discretionary ratio, like equities, is starting to move off of the recent bottom. This is an important ratio, not just for what it suggests about future consumer spending patterns, but also for flagging the extent to which investors feel compelled to favor the more defensive consumer staples stocks or the more speculative consumer discretionary ones.


2 comments:
Dear Vixman, love your blog - very interesting stuff but in this case - you need to drag your history back a little more to really see how crazy stuff can get...The current level of around 1.1x is way off the 0.84x lows back in Nov 2000 and March 2000 actually saw the highs of the last cycle at around 1.4x. We did also see a 0.9x reading on 9/11. I agree short-term bottoms in the last few years have tended to coincide with short-term bottoms in equities but I feel this time we have a more reflexive (hat-tip to Soros) self-reinforcing cycle turn. Talking my book but short-term money market stress is still there, VIX's ascending triangle breakout was seen back in 2000/2001 also and spiked post, and in my stomping ground of CDS, indices are trading considerably too tight (strong) compared to underlying component weakness.
Keep the info coming - i love it - especially the stuff on SPX/VIX, VIX/VXV etc - would love to see your thoughts on the risk premium embedded in this over the last few years - seems like if we discount the last few credit-expansion-fueled craziness, then we are mid range but hard to argue with the charts...I guess it is another nod Mr. Soros that we are expecting a reversion to some equilibrium when housing is unlikely to magically recover and find a bottom without some significant intervention that is unlikely to come before November...
Wow, this post went a lot longer than i expected...LOL.
cheers
Thanks for weighing in credittrader (not to worry, long comments are encouraged); you make several excellent points. For starters, the monthly chart of the XLY:XLP is much less clean than the one I put up, which is why I chose to focus on the past few years. In short, the ratio's action during the 2000-2002/3 bear market shows a lot more noise, but the correlation is still there.
With respect to housing, I'm not sure what sort of intervention (short of a foreign currency shopping spree) is going to kick start a turnaround. My sense is that only time -- and lots of it -- will turn things around.
Finally, regarding the embedded risk premium, this is something I continue to mull over, but don't have anything I am ready to share at this stage.
Cheers and good trading,
-Bill
Post a Comment