VIX Numbers and Overbought Signals
From the looks of some of the Google searches that have been attracting readers to the blog today, it appears that a sub-20 VIX that is more than 10% below the VIX’s 10 day simple moving average has a lot of people wondering about overbought signals.
I have talked about various rules (MarketSci rule, Trading Markets 5% rule, etc.) which utilize the VIX to signal overbought and oversold conditions and I can summarize my thinking briefly here:
- Focus on the relative values of the VIX (i.e., with respect to a recent trading range) instead of absolute values
- Consider the cash VIX in the context of expectations for future volatility
- The more extreme readings give more reliable signals
- History favors mean reversion for the VIX
- Mean reversion does not always happen quickly, so scale in to a position
- If you follow good risk control, VIX signals are one of the few ones for which it is acceptable to add to losing positions (assuming the mean reversion signal is still valid)
- Be sure to start taking profits in no more than 1-2 weeks
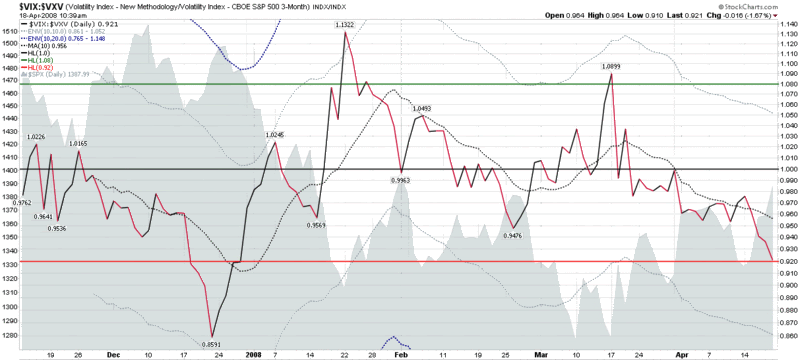
So…that is my thinking. A sub-20 VIX? Not really relevant. A VIX more than 10% below the 10 day SMA? Generally tradeable. A better signal? While it is still too early ‘cling tightly’ to the VXV (an index that calculates the 93 day implied volatility for the SPX options), I am bullish on the VIX:VXV ratio – and the chart of that ratio suggests that the market is approaching an overbought condition.


3 comments:
Hello,
What do you think about the VIX evolution of yesterday .... do you think this 1400 on the SP500 ( confirmation of this dubble butom) is a reason of this strong VIX.... ? For me since we did not break this res. trader will stay very deffensif using options to lock there gains ? is that possible ?
punky trader
Hi Punky,
I am not backing away from my earlier prediction that the VIX will spend a good portion of the year in the 22-26 range. At the time I made that prediction, the markets were still searching for a bottom and my numbers were a lot lower than the consensus, but now I note that the VIX futures are all clustered in the 22-23 range, with a low of 22.20 for May '08 and a high of 23.55 for Feb '09.
I do think that the ongoing tests of SPX 1400, NASDAQ Comp. 2420, and RUT 735 will shape what happens on the volatility front. Throw in XLF 30 just for fun too.
Getting back to the SPX, keep in mind that we still need to see a close above 1400 -- and 1420 lurks as important resistance (prev high, Fib, etc.) as well.
Regarding SPX puts and puts in general, I saw a fair amount of put action on Wed and Thu, but not on Friday.
I think it's going to be a lot of 'wait and see what the market does' trading for the near term.
Good trading,
-Bill
Bill,
Very helpful guidelines, thanks. As I have a job that somewhat depends on an expanding economy and am nearing retirement (5 yrs), I carry a small core position short the Russell 2000 (TWM) in my rollover IRA as a kind of put against career blowup or some other macro Black Swan. (Had a nice ride on gold earlier but converted that position to cash the day GLD broke below its 50-day MA. The GLD chart still looks ugly.) I was eying the 3-year $VIX over at stockcharts.com and thinking 18 would be a good entry point for a little more TWM and 16 a good point to double up. Your much more sophisticated VIX:VXW analysis kind of confirms what I was thinking. If I do jump in, I'll be especially heedful of your advice to jump out in two weeks or less on the non-core part of the position.
Fat Tail Rider
Post a Comment