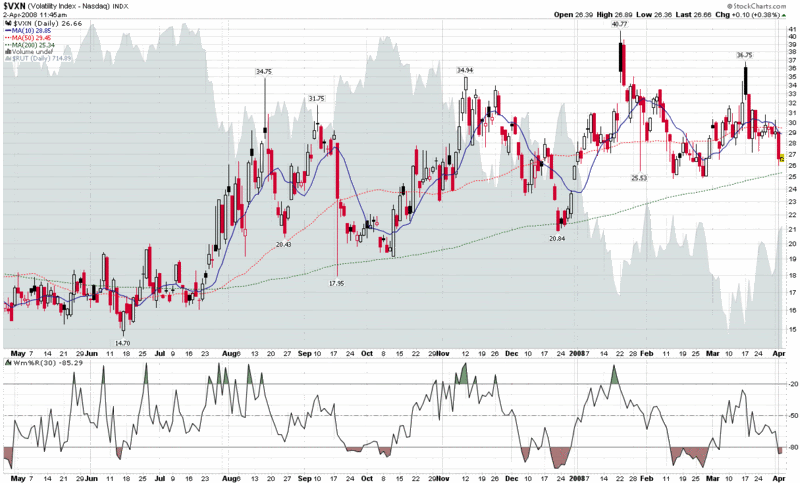
Turning to the VXN…
Yesterday, I presented a chart of the ratio of the VIX to the VXV and offered the interpretation that this indicator was suggesting little more than a mild overbought condition.
Now that we have a 400 point rally in the DJIA in the books, it seems that quite a few pundits are pointing to the VIX and calling the market overbought. Yesterday I barely stopped short of saying that the study of the percentage deviation of the VIX from the 10 day SMA is the “lazy man’s way to interpret the VIX,” but truth be told, that is about where I come down on the subject (with apologies to all the women who fall into the same trap.)
Yes, it is important for traders to keep their stable of indicators simple and easy to manage, but in doing so there is always the risk of oversimplification.
Getting back to the VIX, it is down another 0.18 (0.8%) as I type this, while the SPX is up 0.44%. I’m sure that makes the 10%ers even more convinced that the market is about to pull back, but I am not prepared to accept that interpretation. The VIX:VXV ratio continues to move sideways today and other volatility measures – which I vow to give more space to going forward – show more of a range-bound pattern than anything resembling the plummeting volatility that the 10%ers are undoubtedly seeing in the VIX.
Recall that financials are the largest component of the SPX, which means they also have the heaviest weighting in the VIX (the same is true for the S&P 100 index, a.k.a. the OEX, and its volatility counterpart, the VXO.) That being said, now that the Bear Stearns (BSC) situation has been resolved, the Fed has expanded its role to enhance the liquidity of the investment banks, and Lehman Brothers (LEH) appears to be out of the woods after experiencing strong demand for its $4 billion convertible preferred offering, it should come as no surprise that volatility which is closely tied to the financial sector is showing the steepest drop. As an example, the most closely watched financial sector ETF, XLF, has seen volatility drop 36% since the March 17th high. By the same token, falling volatility has taken the VIX and VXO down below their 200 day simple moving averages. Move over to the VXN (the volatility index for the NASDAQ-100 or NDX), however, and the picture is much less dramatic. Instead of falling volatility, the chart shows range-bound volatility going back to August 2007 and current readings still comfortably above the 200 day SMA, albeit with a pattern of higher lows. Given the relative weightings of the financial sector in the various volatility indices, from my perspective a strong break in the VXN below 25 would be a better broad-based sign of falling volatility than most of what we can discern from the VIX and the moment.


0 comments:
Post a Comment