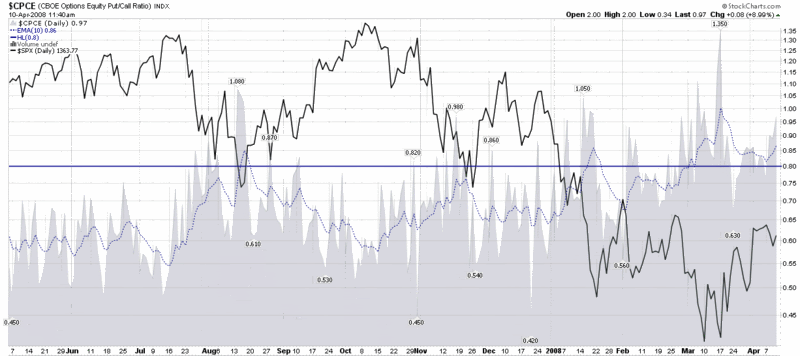
Persistent High Put to Call Ratio
The last time I mentioned the CBOE Equity Put to Call Ratio, one month ago today, it was at such elevated levels that I titled the post Put to Call Everest and limited my commentary to a brief question, “What number comes after infinity?” The extreme put to call data even inspired me to make my first major bottom call since trying to catch the bottom in the NASDAQ in 2002 (I was also a little early then, but close enough.)
Fast forward one month and the put to call data continue to show a preponderance of non-believers, with put buying dominating the options activity. Given the headlines of the past few days, this widespread pessimism is easy to understand. The more important question is how long it will endure.
Critical market bottoms are almost always marked by a spike in put to call ratios. For aggressive investors, the current levels probably offer an attractive risk-reward profile. More conservative investors may wish to wait for a confirmation signal, such as the 10 day exponential moving average of the CBOE Equity Put to Call Ratio dropping below 0.80 (the blue horizontal line in the chart below.) More market shocks certainly lie ahead, but history suggests that the current environment has a high probability of producing above average returns – perhaps even considerably higher than that – over the next month or two.


7 comments:
So the $5 million question: is it bottom now?
Couldn't one say that the market is heading lower because of all the put selling???
Do these statistics distinguish between the "regular" equity puts/calls and the put/calls on the inverse ETFs?
If they don't, doesn't it make this a "not-a-useful-one" indicator?
Myguest,
I give the March lows a higher likelihood of holding up than most pundits, but I wouldn't say that the odds are any higher than 2-1.
Anon1,
Yes, the massive put selling is one of the reasons I am fairly bullish right now.
Anon2,
Truth be told, I put more stock in the ISEE data than the CBOE data, particularly the ISEE Equity data, which excludes ETFs. I have an indicator I have had excellent success with, the OSI (Options Sentiment Indicator), that I just rolled out in my subscriber newsletter that relies fairly heavily on the ISEE Equity numbers. I'm not sure how the CBOE handles ETFs and inverse ETFs.
I would appreciate it if anyone in the know could clarify this important question.
Cheers,
-Bill
Bill,
due to the fact that
a) the CBOE does not list any ETF in its monthly CBOE Equity Option Volume Archive (only stocks are listed, Excel format),
b) differentiates between Equity Volume, (Cash) Index Volume and Volume on ETF in it's annual statistics and
c) there is a specific section called "CBOE Daily ETF Market Statistics" on the same level as "CBOE Daily Market Statistics" (and not as subsection),
d) especially Inverse (Short) Market Cap ETFs and Leveraged Inverse (Short) Market Cap ETFs are NOT listed at all under "CBOE Market Summary" (as if options on these ETFs would not be traded on CBOE although they are)
is seems more than probable that options on ETFs are NOT included in equity or index options volume and therefore are excluded from the respective ratios as well.
Best regards
Frank
Bill,
Could you please explain the difference between put selling and put buying???
Thanks,
Tony
(anon1)
Hi Tony,
I assume you are asking about purchases and sales of puts in the context of the index calculations, as every transaction obviously has to include both a buyer and a seller.
Here again I am not that familiar with the CBOE methodology, but the ISE uses only customer opening long positions. By customer, this means that transactions initiated by market makers and firms are excluded. In using opening positions only, this eliminate transactions used to close out all or part of an existing position. Finally, a new long positions means that the ISE will not include naked sales, covered calls, and spreads (or other multi-leg strategies) in their ISEE data.
Of course the ISEE methodology is not perfect -- it cannot flag calls opened to hedge against an existing position, for instance -- but I believe quite strongly that their approach provides a robust data set that has a number of valuable uses.
I hope this helps.
Cheers,
-Bill
Post a Comment